As you may have noticed, we’re working on an all new version of Basecamp called Basecamp 3. We want to build the fastest version of Basecamp yet, so we’ve been hard at work on optimizing performance. One of the things we’ll be doing to improve both performance and reliability is to serve Basecamp 3 from two datacenters: one in Chicago, IL, where our other applications are all located, and our second site in Ashburn, VA that we’ve brought online over the past couple of years. We recently optimized how traffic reaches these datacenters by using Anycast BGP.
Continued…Signal v. Noise: Sysadmin
Start with our Best Hits on Sysadmin
- ⋆ Behind the Scenes: The Hardware that Powers Basecamp, Campfire and Highrise
- ⋆ Link: A new 37signals project: Pow
- ⋆ Nuts & Bolts: Potpourri
- ⋆ Nuts & Bolts: Storage
- ⋆ Nuts & Bolts: Database Servers
- ⋆ [Podcast] Episode #12: Being a Systems Administrator at 37signals
- ⋆ Nuts & Bolts: HAproxy
- ⋆ Behind the scenes at 37signals: Sysadmin and development
Our Most Recent Posts on Sysadmin
When Disaster Strikes

Nearly 3 years ago we asked “What would happen if a truck crashed into the datacenter?” The resulting discussion could be summarized as “Well we would probably be offline for days, if not weeks or months. We wouldn’t have many happy customers by the time Basecamp was back online.” No one was satisfied with that answer and, in fact, we were embarrassed. So we worked really hard to be prepared with an answer that made us proud.
This past Sunday, February 15th 2015, we demonstrated that answer in public. With one command we moved Basecamp’s live traffic out of our Chicago, IL datacenter and in to our Ashburn, VA datacenter in about 60 seconds. 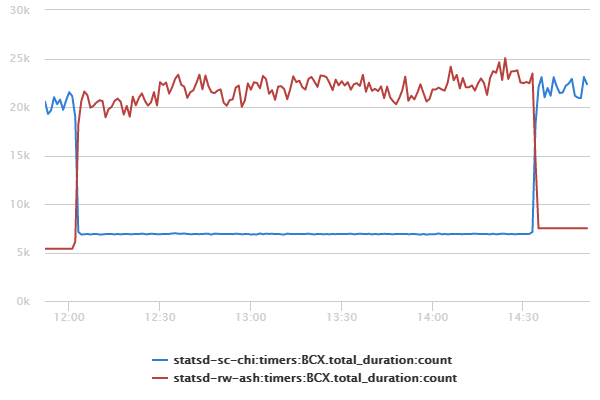
Not one of our customers even noticed the change, which is exactly as we planned it. A few hours later we ran one command and moved it all back. Again, no one noticed.
This probably qualifies as the least publicly visible project at Basecamp. And we hope it stays that way. But if it doesn’t, just know Basecamp will be online even if disaster strikes.
(There’s much to share about how we accomplished this and what we learned along the way. I’ll share the technical nitty gritty in future posts.)
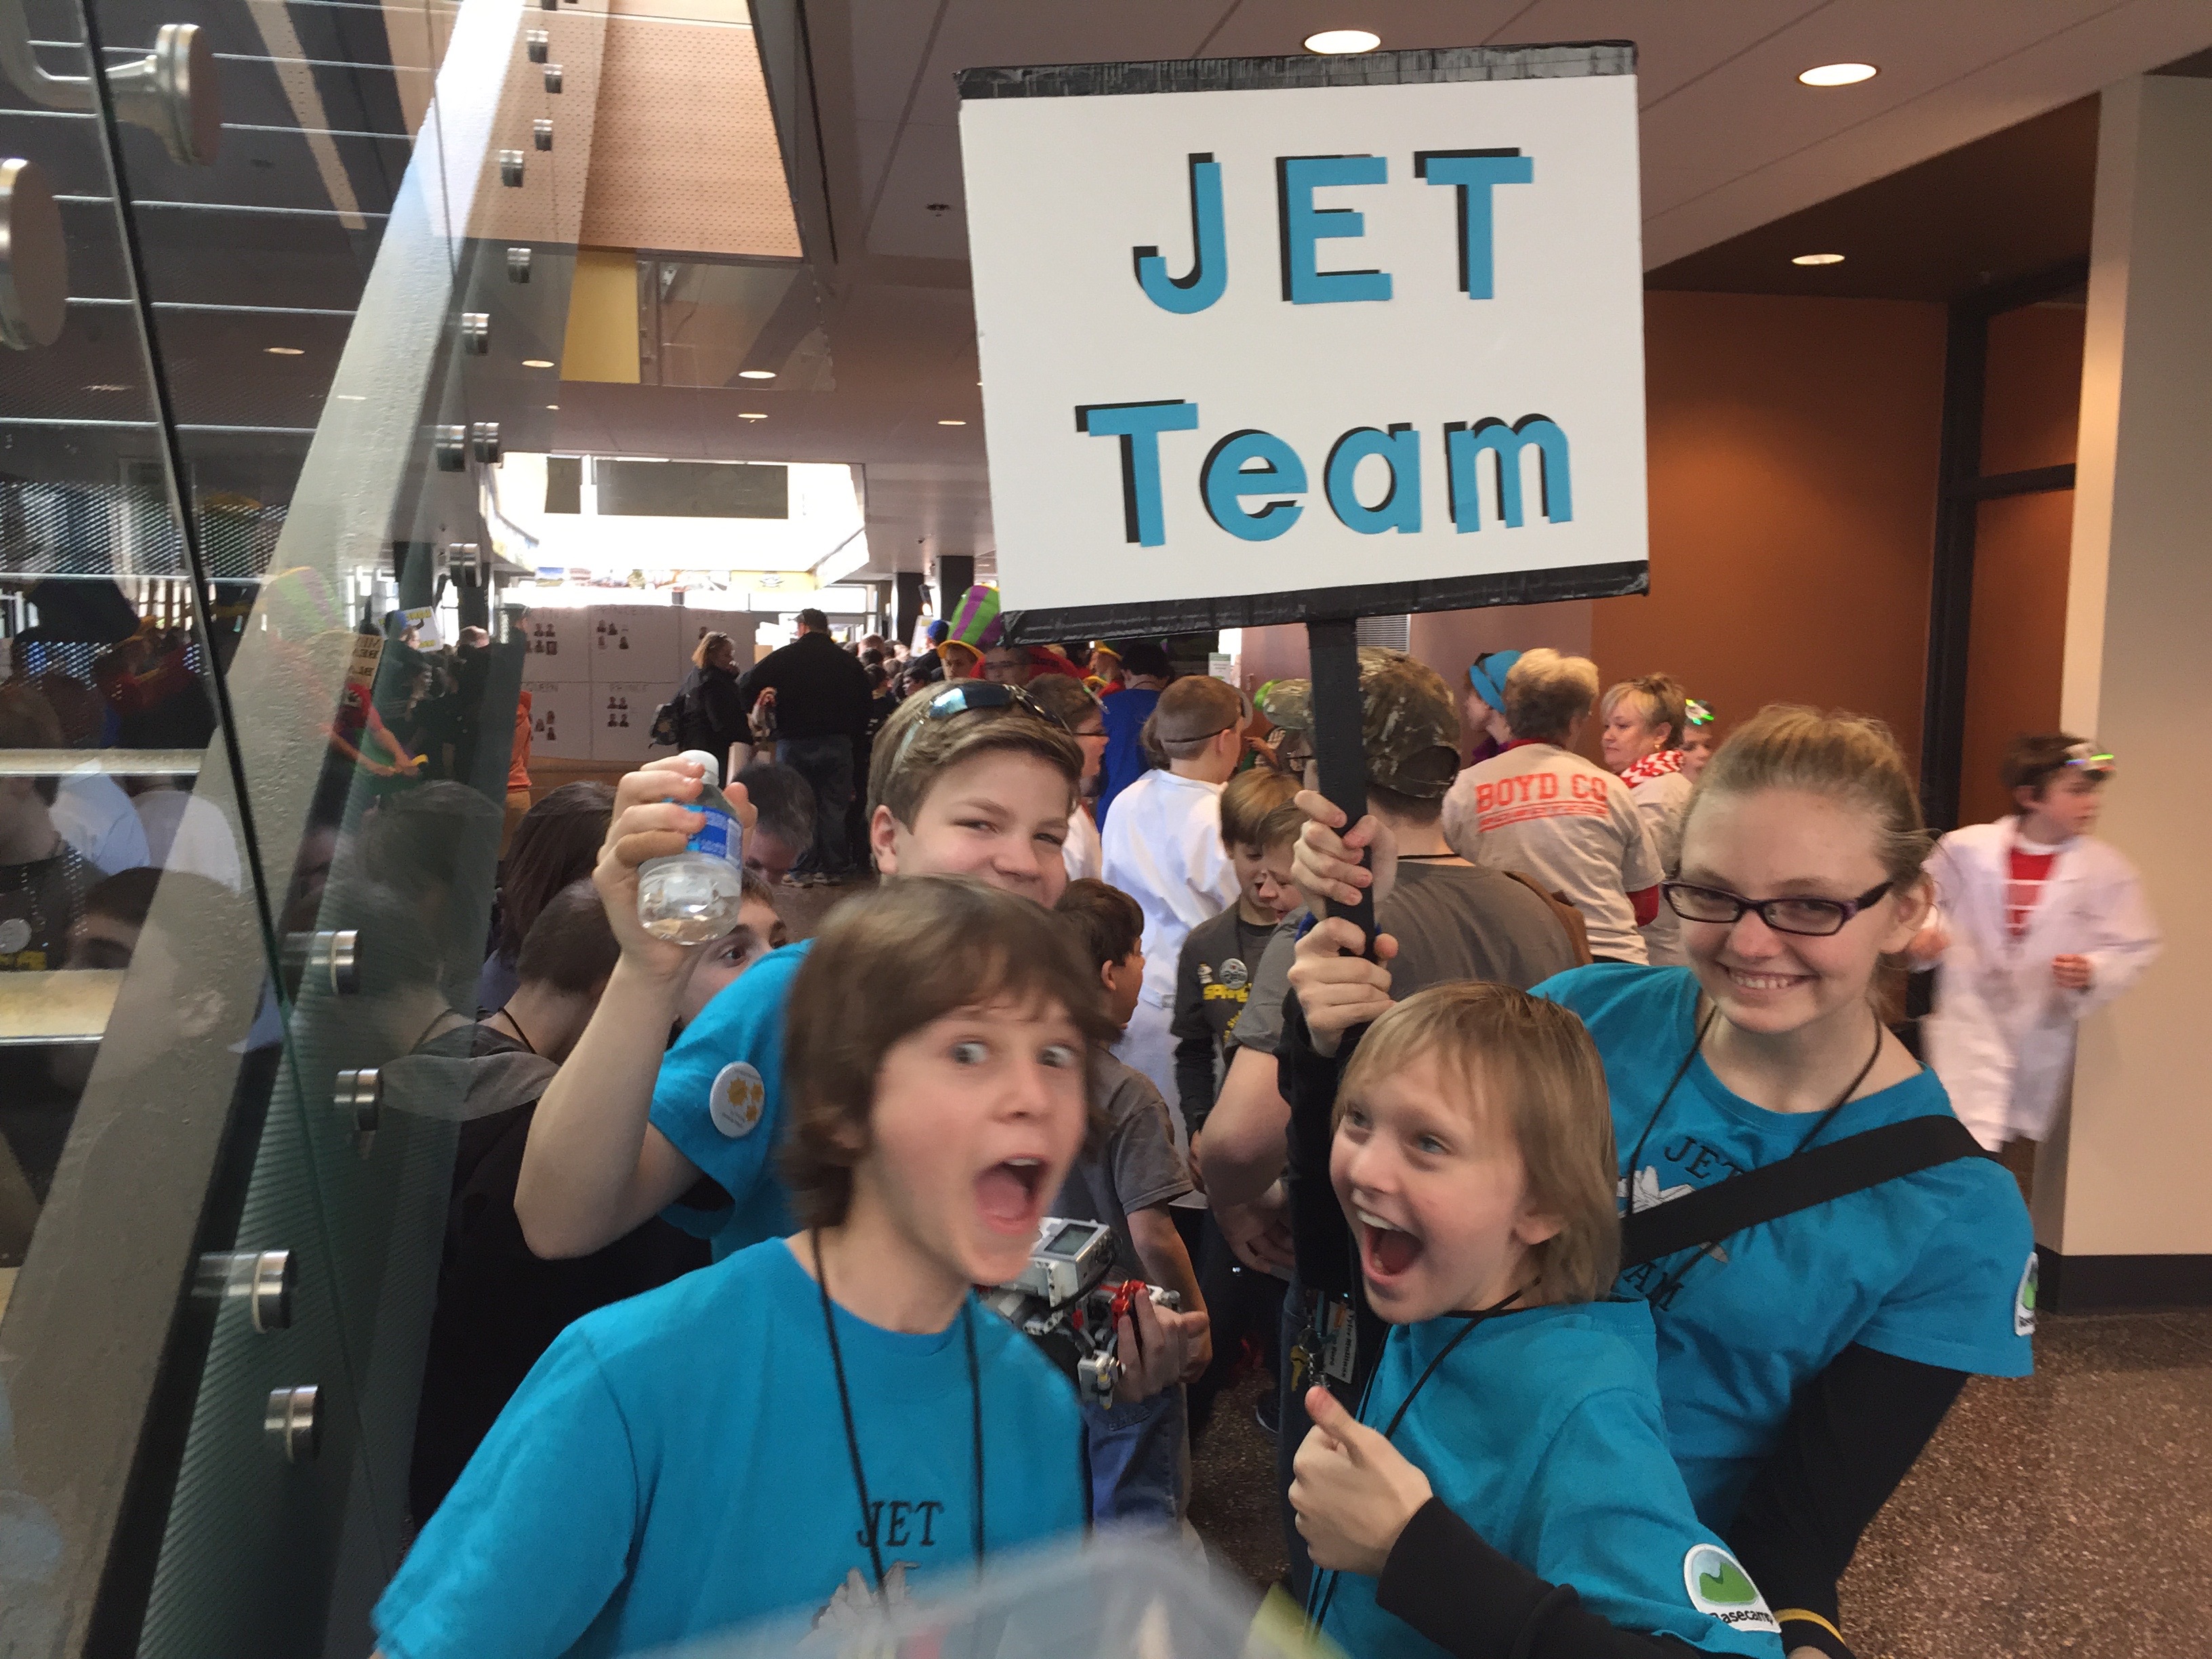
Deploying to production is stressful for 12-14 year olds!

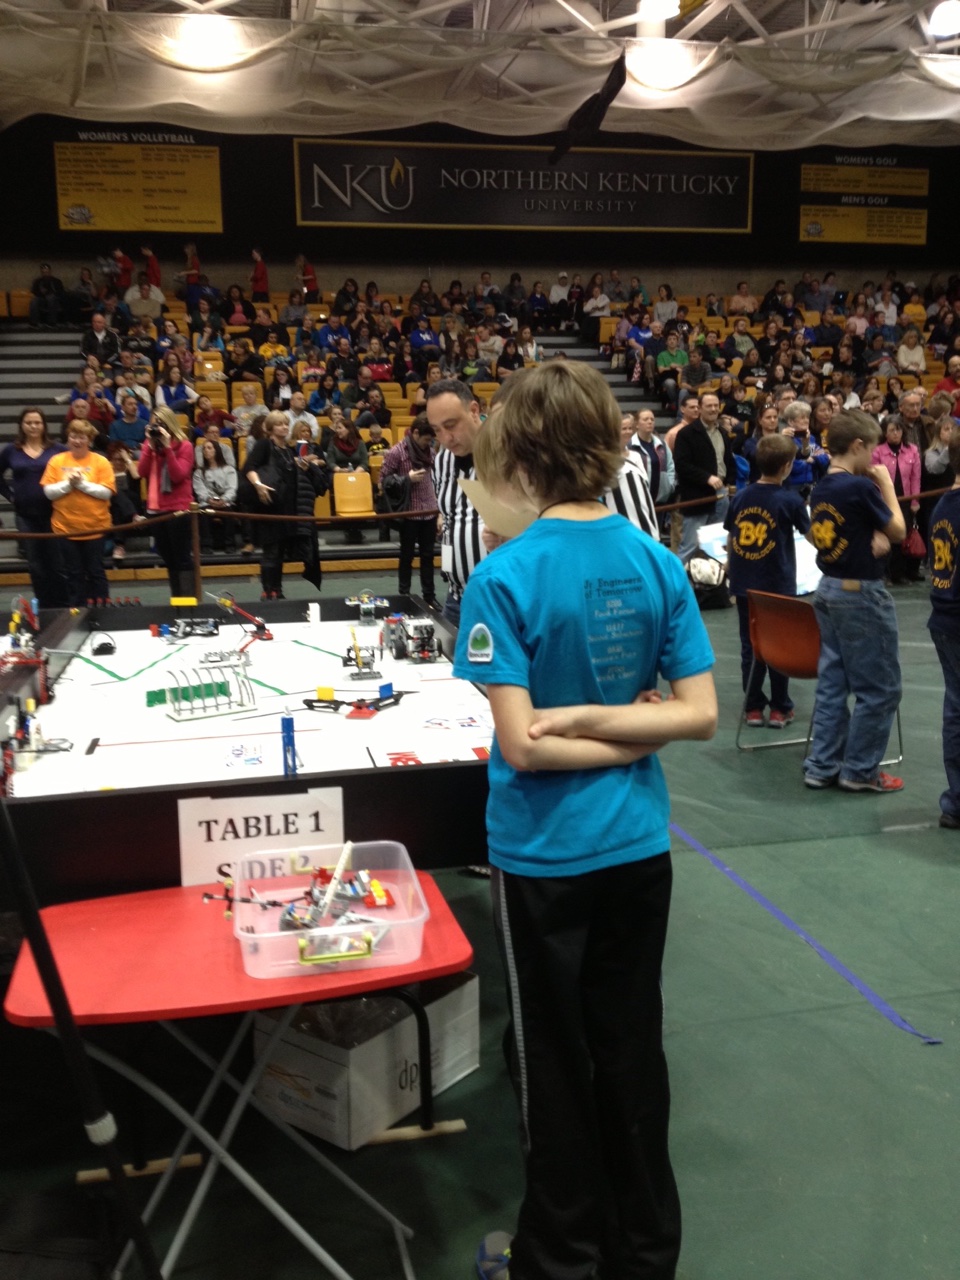
I watched in disbelief as the robot crashed into the mission model. It had run the exact same mission hundreds of times during practice. We never worried about this step; it was always successful. It was “dial-tone” reliable. We had practiced on multiple tables, under different lighting conditions, trying to chase out any strange bugs that might be lurking in our assumptions.
The Jet Team member in charge of the table grabbed the robot and put it back in base; extremely frustrated. With the clock running and the parents and other teams cheering; they had little choice but to try it again. Unfortunately, the previously rock solid mission was now failing as often as it was previously succeeding. It crashed into the mission model again. Once more, they incurred a 10 point touch penalty and brought the wayward robot home. Hands quickly and deftly replaced the attachment on the robot with the one for the next mission while the other team members yelled, “Skip it! Go to the next mission!” from the sidelines. 8 seconds later, the robot trundled out of base again, leaving 125 points unclaimed forever in the past, on its way to the next mission.
After the timer expired and the buzzer sounded, the team members collected the robot attachments and we made our way off the arena floor, mingling with the 7 other teams leaving the other tables, having experienced their own trials or triumphs over the last 150 seconds. Some kids looked to me for answers, utter confusion plain on their faces. “Mr. Anderson, what happened? Why did we miss the black line?!” Others looked at their teammates, “It never missed there before, did you load the right program?”
We were at the 2014 Kentucky State FLL Tournament. 47 teams had fought their way here through various regional competitions and we were all competing for a chance to go to the FLL World Festival in St. Louis.
My mind raced back over the program they had written; I could see exactly where the program had been when it failed, but even if I knew the answer, I couldn’t tell them. Coaches don’t program in First Lego League; they shouldn’t even touch the computer or the robot. The temptation is too great to just “fix that that one thing”. So as we walked back to the pits, I fell back to my favorite activity; asking them to describe what they saw, not what they thought the robot did. Slowly, they talked each other through what happened, and the kids started to zero in on the problem.
The kids had written a line following program that would stop when the robot detected a certain reflected light intensity. It was pretty complicated, but they were very proud of it; and it worked very well. Without getting too technical, the robot measures a light intensity between zero and 100, zero being black, and 100 being white. Their program was instructing the robot to stop when it saw zero. There was no margin for error, and when the robot saw black as 1 (or more), it happily continued on its way, waiting for the magical zero measurement that would tell it to stop.
“Bump it up to five!” “Yeah, tell it to look for 5 or less!” Modifications were made, and the program tested once. We had another run coming up in 10 minutes, and had to get back to the arena. The kids looked hopeful as we walked back, confident they had fixed their issue and were going to put a respectable score on the board at last.
As the robot jerked to a stop at the beginning of the line it was supposed to follow, one of the team members looked at me. “It detected the green line as black, and stopped too early!” Resisting the urge to remind them again that the robot had no concept of “too early” and it just did what it was programmed to do, I nodded. Inside, I was ecstatic. They had seen the behavior of the robot and deduced the problem right away!
The sensor the robot uses to measure reflected light intensity uses a red LED. This leads to interesting effects when measuring the reflected light intensity of different colors. A good analog of this is the spy decoder devices that used red cellophane to reveal the hidden messages. Red shows up as white, and green is almost black. In bumping the value up to 5, they had inadvertently strayed into the “green range”.
This time, as we walked back to the pits, I didn’t have to ask anything as the team member who saw the problem explained what happened to the rest of the team. Various theories flew as to the best way to fix it, ranging from “rewrite the program” to “put it back the way it was”.
When we got back to our pit, rather than race back to the computer and start coding a fix, I had them talk through the observed behavior and the proposed solutions. Taking the ten minutes to talk about it, and analyze their options and situation proved far more valuable than spending those moments hacking at the code.
In the end, they decided they didn’t have time to rewrite the program, but they also couldn’t put it back the way it was with any confidence. Since they had bumped up to five, they decided to split the difference at two. They all agreed it was their best option under their time constraints.
The last run, due to their perseverance in tracking down this new bug and their acceptance of the time constraints they were operating under, turned out to be their best. Was it bug free? Nope. Did they get all of the points they hoped for? Nope.
Did they complete their problem mission? Yes!
Did they learn a little bit more about engineering, software development, hard deadlines, and deploying hot-fixes to production? Yes! After their last run, I had the opportunity to draw parallels between everything they had gone through during the last few hours and what we, as software engineers, do on a daily basis.
“I’m so exhausted!” exclaimed one of the team members, “I’m just mentally exhausted!”
“Congratulations on your first production deployment!”, I said. “They get better. Testing and practice are the best way to make them less exhausting, but they’re always exciting!”
In the end, we scored third place overall. No trip to the World Festival, but I got something better; I got to see the team become engineers.
Basecamp network attack postmortem

As we detailed in Basecamp was under network attack, criminals assaulted our network with a DDoS attack on March 24. This is the technical postmortem that we promised.
The main attack lasted a total of an hour and 40 minutes starting at 8:32 central time and ending around 10:12. During that window, Basecamp and the other services were completely unavailable for 45 minutes, and intermittently up and down or slow for the rest. In addition to the attack itself, Basecamp got put in network quarantine by other providers, so it wasn’t until 11:08 that access was restored for everyone, everywhere.
The attack was a combination of SYN flood, DNS reflection, ICMP flooding, and NTP amplification. The combined flow was in excess of 20Gbps. Our mitigation strategy included filtering through a single provider and working with them to remove bogus traffic.
To reiterate, no data was compromised in this attack. This was solely an attack on our customers’ ability to access Basecamp and the other services.
There are two main areas we will improve upon following this event. Regarding our shield against future network attacks:
- We’ve formed a DDoS Survivors group to collaborate with other sites who’ve been subject to the same or similar attacks. That’s been enormously helpful already.
- We’re exploring all sorts of vendor shields to be able to mitigate future attacks even faster. While it’s tough to completely prevent any interruption in the face of a massive attack, there are options to minimize the disturbance.
- Law enforcement has been contacted, we’ve added our statement to their case file, and we’ll continue to assist them in catching the criminals behind this attack.
Regarding the communication:
- There was a 20-minute delay between our first learning of the attack and reporting it to our customers via Twitter and status. That’s unacceptable. We’ll make changes to ensure that it doesn’t take more than a maximum of 5 minutes to report something like this again.
- Although we were successful at posting information to our status site (which is hosted off site), the site received more traffic than ever in the past, and it too had availability problems. We’ve already upgraded the servers that power the site and we’ll be conducting additional load and availability testing in the coming days.
We will continue to be on high alert in case there is another attack. We have discussed plans with our providers, and we’re initiating new conversations with some of the top security vendors.
Monday was a rough day and we’re incredibly sorry we weren’t more effective at minimizing this interruption. We continue to sincerely appreciate your patience and support. Thank you.
Basecamp was under network attack this morning
Criminals attacked the Basecamp network with a distributed denial-of-service attack (DDoS) this morning. The attackers tried to extort us for money to make it stop. We refused to give in and worked with our network providers to mitigate the attack the best we could. Then, about two hours after the attack started, it suddenly stopped.
We’ve been in contact with multiple other victims of the same group, and unfortunately the pattern in those cases were one of on/off attacks. So while things are currently back to normal for almost everyone (a few lingering network quarantine issues remain, but should be cleared up shortly), there’s no guarantee that the attack will not resume.
So for the time being we remain on high alert. We’re collaborating with the other victims of the same group and with law enforcement. These criminals are sophisticated and well-armed.
Still, we want to apologize for such mayhem on a Monday morning. Basecamp, and our other services, are an integral part of how most of our customers get work done. While no data was compromised in this attack, not being able to get to your data when you need it is unacceptable.
During the attack we were able to keep everyone up to date using a combination of status.basecamp.com, Twitter, and an off-site Gist (thank you GitHub!). We’ll use the same channels in case we’re attacked again. If the attack does not resume, we will post a complete technical postmortem within 48 hours.
We want to thank all our customers who were affected by this outage for their patience and support. It means the world to us. Thank you.
December 4th Basecamp Classic, Campfire and Highrise Outage
Basic Explanation
Some background
On Dec. 4 around 5:30 p.m. CT, a number of our sites began throwing errors and were basically unusable. Specifically, Basecamp Classic was briefly impacted as it was very slow. Campfire users experienced elevated errors and transcripts were not updated for quite some time. Highrise was the most significantly impacted: For two hours every page view produced an error.
Why our sites failed
When you visit a site like Basecamp it sends you information that’s generated from a number of database and application servers. These servers all talk to each other to share and consume data via connections to the same network.
Recently, we’ve been working to improve download speeds for Basecamp. On Tuesday afternoon we set up one server with software that simulates a user with a bad Internet connection. This bad traffic tickled a bug in a number of the database and application servers which caused them to become inaccessible. Ultimately this is why users received error messages while visiting our sites.
How we fixed the sites
We powered off the server sending out the bad traffic. We powered back on the database and application servers that were affected. We checked the consistency of the data and then restarted each affected site.
How we will prevent this from happening again
- We successfully duplicated this problem so we have an understanding of the cause and effect.
- We asked all staff not to run that specific piece of software again.
- We know someone might forget or make a mistake, so we set up alerts to notify us if the software is running anywhere on the network. We verified the check works too.
- We are working with our vendors to remove the bugs that caused the servers to go offline.
In-Depth Explanation
Topology
Our network is configured with multiple redundant switches in the core, two top of rack (TOR) switches per cabinet, and every server has at least 2×10Gbe or 2×1Gbe connections split over the TOR switches. Servers are are spread among cabinets to isolate the impact of a loss of network or power in any given cabinet. As such, application servers are spread throughout multiple cabinets; master and slave database pairs are separated, etc. Finally the cabinets are physically divided into two “compute rooms” with separate power and cooling.
Before the failure
We’ve been investigating ways to improve the user experience for our customers located outside the U.S. Typically these customers are located far enough away that best case latency is around 200 ms to the origin and many traverse circuits and peering points with high levels of congestion/packet loss. To simulate this type of connectivity we used netem. Other significant changes preceding the event included: an update to our knife plugin that allows us to make network reconfiguration changes, the decomm of a syslog server, and an update of check_mk.
Failure
At 5:25 p.m. CT, Nagios alerted us that two database and two bigdata hosts were down. A few second later Nagios notified us that 10 additional hosts were down. A “help” notification was posted in Campfire and all our teams followed the documented procedure to join a predefined (private) Jabber chat.
One immediate effect of the original problem was that we lost both our internal DNS servers. To address this we added two backup DNS servers to the virtual server on the load balancer. While this issue was being addressed other engineers identified that the affected applications and servers were in multiple cabinets. Since we were unable to access the affected servers via out of band management, we suspected a possible power issue. Because the datacenter provides remote hands service, we immediately contacted them to request a technician go to one of our cabinets and inspect the affected servers.
Recovery
We prioritized our database and nosql (redis) servers first, since they were preventing some applications from working even in a degraded mode. (Both our master and slave servers were affected, and even our backup db host was affected. Talk about bad luck …) About five minutes after we had a few of the servers online, they stopped responding again. We asked the onsite technician to reboot them again, and we began copying data off to hosts that were unaffected. But the servers failed again before the data was successfully copied.
From our network graphs we could see that broadcast traffic was up. We ran tcpdump on a few hosts that weren’t affected, but nothing looked amiss. Even though we didn’t have a ton of supporting evidence it was the problem, we decided to clear the arp cache on our core, in case we had some how poisoned it with bad records. That didn’t seem to change anything.
We decided to regroup and review any information we might have missed in our earlier diagnosis: “Let’s take a few seconds and review what every person worked on today … just name everything you did even if it’s something obvious.” We each recited our work. It became clear we had four likely suspects: “knife switch,” our knife plugin for making changes to our network; syslog-02, which had just been decommisioned; an upgraded version of the check_mk plugin that was rolled out to some hosts; and the chef-testing-01 box with netem for simulating end user performance.
It seemed pretty likely that knife-switch or chef-testing-01 were the culprits. We reviewed our chef configuration and manually inspected a few hosts to rule out syslog-02. We were able to determine that the check_mk plugin wasn’t upgraded everywhere, and that there were no errors logged.
We shut down chef-testing-01 and had the remote hands technician power on the servers that had just gone awol again. We decided that since we were pretty sure this was a networking issue, and it very likely was related to lacp/bonding/something related, we should shut down one interface on each server in case that too prevented a repeat performance. We disabled a single port in each bond both on the switch and on the server. Then we waited 15 long minutes (about 10 minutes after the server was booted and we had confirmed the ports were shut down correctly) before we called the all-clear. During this time we let the databases reload their lru dumps so they were “warm.” We also restarted replication and let it catch up and got the redis instances started up.
With these critical services back online our sites began functioning normally again. Almost 2.5 long hours had passed at this point.
Finally, we made a prioritized list of application hosts that were still offline. For those with working out-of-band management, we used our internal tools to reboot them. For the rest we had the datacenter technician power cycle them in person.
Resolution
- We were able to reproduce this failure with the same hardware during our after-incident testing. We know what happens on the network, but we have not identified the specific code paths that cause this failure. (The change logs for the network drivers leave lots to be desired!)
- We have adjusted the configuration of the internal DNS virtual server to automatically serve via the backup servers if the two primary servers are unavailable.
- We have added additional redis slaves on hosts that were not previously affected by the outage.
- We are continuing to pursue our investigation with the vendor and through our own testing.
- Everyone on the operations team has made a commitment to halt further testing (with netem) until we can demonstrate it will not cause this failure again.
- We have added “netem” to our Nagios check for blacklisted modules in case anyone forgets about that commitment.
- We are updating our tools so that physically locating servers when Campfire (and thus our Campfire bot) is broken isn’t a hassle.
Additional information
We’ve built a Google spreadsheet which outlines information about the hosts that were affected. We’re being a bit cautious with reporting every single configuration detail because this could easily be used to maliciously impact someone’s (internal) network. If you’d like more information please contact netem (at) 37signals and we’ll vet each request individually.
Using Information About Our Network to Remove Monitoring Noise
Our team adds new checks and alerts every week so that we can stay ahead of new issues. We try very hard to make sure that each alert is configured and tested such that it provides timely and credible evidence of a real problem. Sometimes though, when things go wrong we are inundated with alert information which actually hinders and confuses our problem identification and resolution.
A real world example
A server with two 10 Gigabit network connections experiences a hardware failure and spontaneously reboots. Our Campfire room is filled with alerts not just for the host being down, but also for the switch (ports) the host is connected to.
We monitor the switch ports because we want to know that they are at the correct speed, that there are no individual failures, and that no “foreign” devices have been plugged into the network. In the case of a host failure, the information about the switch ports is secondary to the information about the host—but it represents 2x the volume of alert data we receive.
In cases like this we need to make our monitoring system more aware of the dependencies exist between these checks so that we can eliminate the noise. To do so we use a number of open source technologies:
Continued…Scaling Your Database via InnoDB Table Compression
Basecamp Classic’s database is actually split across two sets of servers. One set contains a single table which is approximately 430 Gbs or more than half the entire volume of data (across both sets) in total.
Two years ago we separated this table because of its growth and size compared to the other tables. By separating the table we could scale the database hardware more closely to data growth, and we kept InnoDB buffer pool evictions to a minimum which made performance more stable.
Recently our monitoring showed some less than desirable metrics regarding this database pair: the least of which was that free storage would be exhausted in about 90 days. There was also a number of slow queries due to insufficient buffer pool space and slow queries from data “on disk”. We had already exhausted the normal tuning approaches and we needed to find a solution for these problems that didn’t involve significant time or money expenditures.
There are two common methods used to keep growing MySQL databases peforming optimally: buying new hardware or reducing the volume of data such that approximately 80% fits in memory. Buying new hardware is expensive and usually incurs a high time and staffing penalty. In most situations reducing the amount of the data is impossible because the database is actually growing through active use.
Continued…Hi. I'm Nathan, the 38th Signal.
The newest member of the operations team.
I’ve spent the last 11 years at a Fortune 50 company, working with a fantastic team of people to build and maintain the brains behind one of the most incredible industrial facilities I’ve ever seen. Despite the efficiency of “the machine,” my work was increasingly complicated by conservative technology and development practices.
37signals stands firmly on the opposite end of the spectrum, with an advanced technology stack bent on squeezing every advantage out of staying current (or being ahead), defining best practices in developing and deploying web apps, and continually identifying trouble spots and taking corrective action.
In 2011, I applied for a position at 37signals because I felt my values matched their displayed values: agility and consistency in operations, and deliberate thoughtfulness in their products. Obviously, I didn’t get the job then. But I kept in touch because I admired the company. And, maybe, just a little, because I hoped to see another position open up.
Last year, I attended RubyHoedown and was fortunate enough to carpool with fellow Louisvillian Ernie Miller. After a long, rambling discussion about Ruby, Rails, and programming – but also about happiness; I decided life’s too short to keep doing things I hate! So in an effort to break out of my rut, I started the Louisville instance of OpenHack. (Openhack was started by fellow Signal Nick!)
When 37signals began looking for a Systems Administrator a couple months ago, I knew I had to dream big and apply – my happiness was at stake! And this time my dream came true.
I’m excited to learn many new things and contribute to the operational success of 37signals. I can’t wait to see what the next 10 years bring!
Making Application Maintenance Fun
Today I made intermission public. As I mentioned in my post about mysql_role_swap we’ve been working hard to limit / eliminate the impact our operations maintenance tasks have on our customer’s experience.
A few people noticed the /tmp/hold “leftover” in mysql_role_swap script. intermission is a product of that early exploration with coordinating database maintenance with request pausing in the web application tier. I’ve done a good bit of non production testing with intermission, but only limited production testing.
Last Friday we used intermission with mysql_role_swap to move Writeboard’s database to a new server. We had a single user facing exception, and we think it was likely caused by something other than the maintenance. For Friday’s maintenance we enabled request pausing via intermission, ran mysql_role_swap, restarted the unicorn (rails) processes, and then unpaused the requests. Total maintenance time was just a few seconds!