
2014 was a big year for Basecamp’s support team—we expanded our coverage hours dramatically and added phone support for the first time. Below is the summary of the year from a quantitative perspective that I shared with the team this week, reproduced here in its entirety.
Email case volume grew in 2014
We closed the book on 2014 with 123,350 cases, a 24% increase over last year (and just shy of the record setting 127k cases post-BCX* launch in 2012). Monthly case volume was pretty steady over the course of the year, with less of a summer/fall dropoff than we’ve seen the last few years:

Wednesday remains our biggest day for cases by a tiny bit, but we also saw a relative increase in Sunday cases this year.

U.S. mornings (up to about 2 p.m. UTC) continue to be our busiest time by far, and we actually saw a relative increase in mornings this year, with comparatively fewer cases coming in the afternoon.

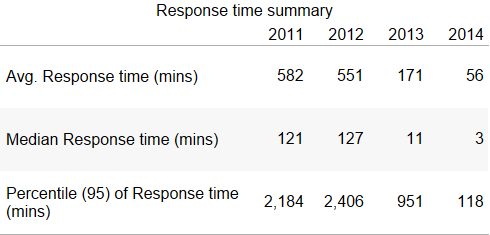
Response time improved dramatically
In 2012 we had coverage during US business hours, roughly 7 a.m. – 6 p.m. CST five days a week; in 2013 we were doing a little better, with coverage 7 a.m. – 9 p.m. CST five days a week. This year we reached 24/7 coverage (with the occasional vacation).

Thanks largely to that investment in getting to 24/7 coverage, we continued to make a dent in response times this year, with the median time to response across the entire year falling slightly to 3 minutes. For comparison, back in 2011 and 2012 our median response time for email cases was over 2 hours. Even more significant is what happened to the tail—95th percentile response time fell from 16 to 2 hours.
Response time took an especially noticeable drop downwards in April when we started to add 24/7 support in earnest:

Not surprisingly, the biggest impact on response time was seen on the weekends, where we cut median response time from about 8 hours to 6 minutes. We made a dent on weekdays too, with median response time falling from ~10 minutes to ~3 minutes.

Those overall weekday response time improvements came largely from the addition of full overnight coverage, which has brought the wee hours response time to about the same as daytime:

Case types: more BCX, constant on-call load
The absolute number of on call cases (including both level 2 and on-call programmer cases) rose slightly this year to 5,805 (or about 22 per day, from 19/day in 2013), but relative to our overall increase in case volume on-call load fell by about 5% this year, thanks largely to improved tooling & root cause fixes.

BCX unsurprisingly makes up the biggest chunk of our cases, and that increased this year as Classic, Campfire, and Backpack cases each fell by about half in absolute terms. Absolute Highrise case volume remained almost exactly constant over the last year.

Accounting / billing issues are the single biggest category of cases that we receive, and increased the most dramatically vs. last year. We also saw a modest increase in the number of access trouble cases, while recording decreases in broken things/bugs and sales related inquiries.

Phone support
This was the year we added phone support, and we closed out the year at just under 3,000 phone support requests from customers. The median call waited just 39 seconds (and 5.5 minutes at the 95th percentile) for us to call them back, a wait time that many inbound call centers would envy, not to mention the fact that we’re doing callbacks! Calls clocked in with a median duration of 2.5 minutes, and a 95th percentile duration of about 10.5 minutes.
We saw pretty steady phone support volume over the course of the year, with changes as we changed the various places you could get access to the callback option.

Phone call requests almost exclusively come on weekdays from US & European customers, despite the fact that we offer it for parts of the weekend and overnights. Calls skew a little later in the day than cases do.

Other support projects this year
This was our third year of offering Twitter support, and we saw a modest decline in the number of tweets we sent out (to about 30/day, from 34/day). Tweeting is also a mostly weekday activity, and also skewed a little later in the day than do email cases:

This was also our third year offering webinar classes, and we clocked in at 102 classes offered in 2014, continuing our steady increases year over year:

Finally, we continued our steady march of making customers happier. 93.32% of Smiley responses in 2014 were of the “great” variety, a slight increase from last year:

All in all, a great year! We handled more cases while improving response time dramatically and holding the line on customer happiness and on call volume—a job well done!
* I refer to the new Basecamp launched in March 2012 as “BCX” throughout this post.
Laure
on 06 Jan 15This is inspiring. :) As a person with a bias, curious what made you go with all-phone support for your synchronous communications, vs. chat? Is it something you still consider?
Michael
on 07 Jan 15Very interesting data and nicely done. I would expect on-call to drop off exponentially next year, i.e. 5% reduction is the beginning of a curve. My thinking is that many of the on-call bugs must be rarely encountered issues so you’d only start to avoid recurring support requests about them several months or years later. New features would generate on-call but not as quickly as the exponential pile of fixes to the mature project accumulate. Is that a plausible prediction?
johnson
on 07 Jan 15What sort of tools does support use and how do they interact with the rest of the team to close cases? -johnson
Chase Clemons
on 08 Jan 15Laure – We haven’t ruled chat out for the future. A phone callback system was something we wanted to try out first. Some cases like billing questions are usually handled faster with a phone call than over an email.
Johnson – We use a few internal tools for handling Twitter and phone cases. For email, we’re currently using Desk.com but have been testing out a few other apps as well. When it comes to closing cases, there’s not a secret formula – anyone on the team can grab a case and work with a customer. With 24/7 support and everyone in the company pitching in, we can get back to any customer within just a few minutes.
Bob
on 08 Jan 15So were the the charts and metrics in the post pulled from Desk.com? Our organization is evaluating ticket management systems for our support staff and this level of reporting is pretty impressive.
NL
on 08 Jan 15Bob – nope, we mirror all of the data from Desk into a database of our own (along with the data for our Twitter and phone support, which we run through an internal tool, and the results from Smiley). The charts here were all generated with Tableau from that data.
Alex
on 09 Jan 15This is so helpful, thanks for sharing!
I’m curious what your team’s schedule looks like – those are impressive response times. :)
Chase Clemons
on 12 Jan 15We typically work an eight hour shift in our timezone. Since we’ve got team members in countries around the world, that gives us 24/7 coverage without anyone having to work an overnight / awkward shift.
This discussion is closed.