Screens Around Town: NYTimes.com 12 Sep 2006
7 comments Latest by Cheap Web Hosting

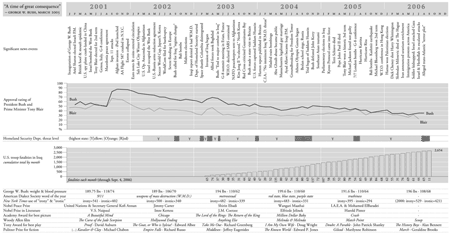
This “Five Years of Consequence” chart is “an attempt, admittedly selective and incomplete, to survey the first five years of our post-9/11 world.” Good luck with that task. It is an interesting compilation of data though.

The main video box on the Times home page needs better labelling. A caption on the big image would make it more meaningful.

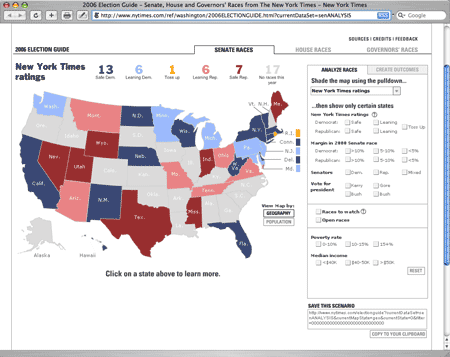
The 2006 Election Guide lets you analyze over 500 races for the Senate, House and governor seats and paint the political map yourself using criteria like margin in 2000 senate race, previous votes for president, poverty rate, median income, etc.

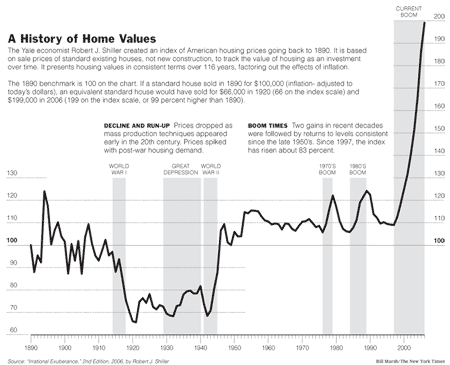
This history of home values chart offers some nice context by offering inline explanations of dips and booms. Related: Real Estate Vs. Stocks at Forbes.com. (“If you take a longer view — say 25 years — you’ll find that the S&P 500 has actually stomped the real estate market.”)
7 comments so far (Jump to latest)
sj 12 Sep 06
The ‘stock market vs. real estate’ discussion isn’t entirely accurate. A personal residence is not an investment, and comparing one’s home against a stock portfolio is an apple to orange comparison. An investment’s goal is to put money in your pocket, which a home doesn’t do. Mortgage payments, property taxes, maintenance, etc. all drain money out. When you sell you might experience some appreciation, but rarely does someone sell and pocket the money - they usually sell to buy something bigger. None of which means a home is a bad purchase - but it does mean one needs to know what they’re buying.
On the other hand, someone who buys real estate and rents it out (be it residences, apartment buildings, commercial property, etc.) who knows what they’re doing is going to stomp a stock portfolio every time.
- You’re money is highly leveraged. Even if you are extremely conservative, you put 20% down on a $250K property and you’re in control of all $250K. Go to a bank and ask for 80% of 250K to buy stocks - never will happen.
- That means you’re able to get appreciation based on that 250K, not just on the money you put down. So, if your property appreciates and is worth $300K, you’ve made 100% ROI (50K on your 50K down payment.) If you’re smart and the property is still able to be financially viable, you can pull out your equity, buy another asset, and still own the first one.
- Investors don’t speculate (in real estate OR stocks.) Investors buy a property not because of the hope that it will appreciate in value (although that’s generally a safe bet,) but because it will get them cash flow each month. They’ve analyzed the property and made sure that the rents they charge will cover the debt service AND put money in their pocket each month. So they get the benefit of regular, sizeable monthly payments and capital gains.
- Real estate ALSO lets you claim depreciation on the property. So even though your property is going up in value (usually) you’re able to offset income with ‘phantom depreciation,’ cutting your tax burden.
- You can defer taxes indefinitely. You don’t pay capital gains unless you sell the property, but most investors continue to put off capital gains by doing a 1031 exchange, allowing them to delay paying taxes as long as they buy a a larger property. People sometimes wonder how the local yokel managed to accumulate such a large real estate portfolio - they did it buy playing monopoly, buying houses, renting them, trading them in for a hotel (or apartment complex, or storage facilty, etc.)
All of this isn’t to say that real estate isn’t risky - you should know what you’re doing, always do your due dilligence, etc. But while stocks are more liquid, you don’t have control over what happens - you can’t fix up your stock to make it attractive to other buyers, you can’t get your hands dirty in the company you’re purchasing, you can’t leverage your investment nearly as well, and you can’t take advantage of tax advantages.
It’s also worth noting that anyone in the financial services community (who generally work off of commission) will probably have the same opinion as Forbes. In fact, it probably pays to look at who’s paying Forbes - look at the advertisements, see who’s funding the company, and you’ll likely see why their perspective is what it is.
Joe Harris 12 Sep 06
The author of the top graph is my new hero of information design. I’ve often though that he was influenced by Tufte by this chart is the clearest sign. Those of who haunt the Tufte forum will immediately recognise the use of a serif font.
His first book (that I’m aware of) ‘Schott�s Original Miscellany’ is an instant classic. Highly recommended. It is suprising how entertaing a compendum of seemlingly random information can be. And how much acerbic wit can be employed without stating an obvious bias.
Brooks Jordan 12 Sep 06
>The main video box on the Times home page needs better labelling. A caption on the big image would make it more meaningful.
Thanks for pointing out. EVERY time I look at that box, I wonder what the video is, but I won’t look because I don’t want to waste my time with an intro and first few seconds of play time to find out.
J. Bish 12 Sep 06
Another amen to the suggestion the the videos in the video box be labelled. Am I suppoed to intuit what the video is about based on the still frame of an old lady staring into the distance?
Aaron Blohowiak 12 Sep 06
to me, an interesting graph would be the ratio of annual income to house price…
the wages for the American worker havent kept pace with property values nor with corporate profits…
where is all of the money coming from that has kept spending so high? loans on “new equity” -> people leveraged the artificially inflated values of their homes to maintain standards of living, and got themselves locked into variable rate mortgages with high pre-pay penalties…
::sigh::
Ben 13 Sep 06
I’m disappointed that the PDF download of a very information-dense & intricate chart is simply a raster scan, not a vector document that I can get close up to. Why not offer a GIF guys?
Cheap Web Hosting 19 Sep 06
Hmm, on this graph the latest boom appears unprecented.