
Kristin wrote about our efforts to achieve 24/7 support, and it reminded me of a project I worked on last year. When we started talking about expanding the support team to improve our coverage outside of US business hours, David asked me to take a look at what we’d need to do to achieve a response time of under four hours for every case that came in, and related to that, what response time we could expect with each hire.
Framing the problem
When we talk about “response time”, we’re really talking about about one specific measure—the time from when we receive an email until we send an initial personalized response back (we stopped using autoresponders over a year ago, so every response we send is personalized). That encompasses exactly what we can control — how long we let a case sit in the queue and how long it takes us to answer. We exclude emails that don’t result in a reply (vacation messages sent to us in reply to invoices, spam, etc.), but otherwise include every single email in measuring our response time.
When we look at response time, we usually look at it one of two ways:
- Median, 95th percentile, and max response time: the point at which half, 95%, and all cases are answered by, respectively.
- Service level: the portion of cases that we reply to within a given time period.
So the goal that David was asking about can alternately be framed as a max response time of 4 hours or a 100% service level at 4 hours—they’re interchangeable.
There’s a really simple mathematical answer to “what do we need to do to ensure a max response time of no more than 4 hours”: at a minimum, you can’t have any gaps in scheduling that are greater than four hours. In reality you need a slightly smaller gap to actually achieve that service level, because after any gap in coverage you’ll come back to find a queue of cases, but at a minimum, there’s no way you can do a four hour max response time if you have a gap in coverage of more than four hours.
That’s a pretty easy and straightforward answer, and gives you a pretty clear idea of how you need to grow the team: hire such that you can make a reasonable schedule for everyone that doesn’t leave any gaps of more than four hours.
That didn’t answer the question of what we should expect in terms of response time as we grew the team over the course of many months, so for that, we moved to a simulation.
Simulating our support workload
Looking at our support workload, it becomes pretty clear that it’s a prime candidate to simulate, for a couple of reasons:
- Our support volume is very predictable: there’s a very strong time-of-day and day-of-week component to our case volume, and a weaker seasonal effect, but in general our support volume is very predictable over long periods of time.
- We operate on a strict first-in, first-out basis: The oldest case in the queue is the next one we answer, and there are no subgroups within the support team that only handle some cases.
- We understand how long it takes to do a case: We’ve been doing this for long enough that we have a pretty good idea of how long it takes to handle a case without rushing, and we have a lot of data about actual case handling times.
With those factors working in our favor, it becomes pretty simple to simulate our support workload in a simple way. All you do is:
- Generate a forecast of our weekly case volume for the coming year and choose the single busiest week. The forecast was generated using a Holt-Winters forecast to identify likely case volumes on a per-hour basis, so we end up with 168 hourly buckets of cases for our forecast. We’ll randomly distribute each hours cases to arrive throughout the course of the hour.
- Assign a complexity to each case according to a distribution of historical case handle times. The mean case takes about six minutes, but we assign a full spectrum of complexities to cases for the simulation.
- Input a weekly schedule for the support team: how many people will work each hour of each day.
Then, for each minute of the simulation:
- Add this minute’s new cases based on the forecast with their assigned complexity to the back of the queue.
- Each team member that’s available grabs the oldest case in the queue and works it. They become unavailable for the duration of time associated with the complexity of the case they grabbed.
- If a team member has completed a case in this minute, mark how long they waited for their reply and mark the team member as being available again in the next minute.
- Repeat for every minute of the simulation.
When you’re done, you have a set of cases, the time they were created, and how long they waited for—everything you need to figure out response time and service levels. Because there’s an element of randomness to this — the exact minute of an hour that cases arrive, whether they clump, and what complexity of case comes in when — run the simulation a few times (or a few hundred, or a few thousand) and you’ve got the range of possible outcomes.
Putting the simulation into production
Conceptually, it’s a pretty simple model, and you could calculate the results entirely by hand if you wanted to, but that doesn’t sound like much fun to do for a bunch of different scenarios. The first version of this model I built used a CSV file to provide team schedules and a manually generated case forecast, but worked fine.
I decided to go a step further and build a little UI around this to make it possible for Kristin or anyone else to simulate how a scheduling change would impact response time. With that, the Support Simulator 4000 was born.
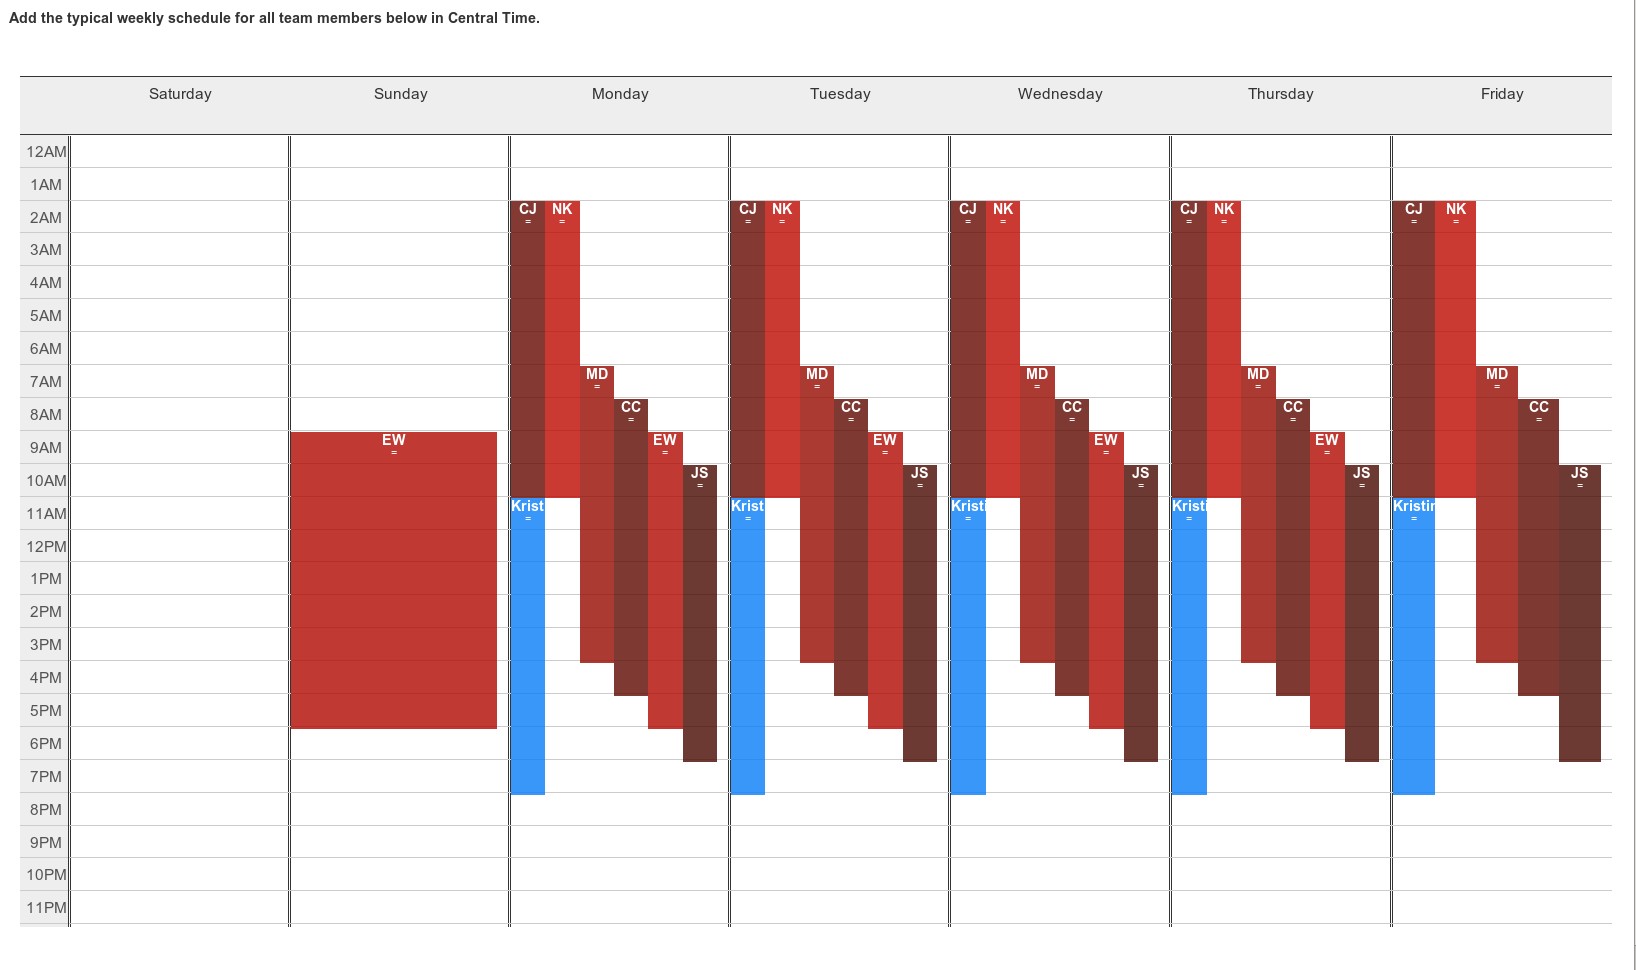
The simulator starts with having you enter the current or proposed schedule using a drag-and-drop calendar editor. This was our baseline schedule when I started simulating in November 2013: we had coverage from Europe on weekdays, Emily was working Sunday through Thursday, and we had no coverage from Friday night until Sunday morning.
That’s all the input necessary. Run the simulation and you get results that look like this:
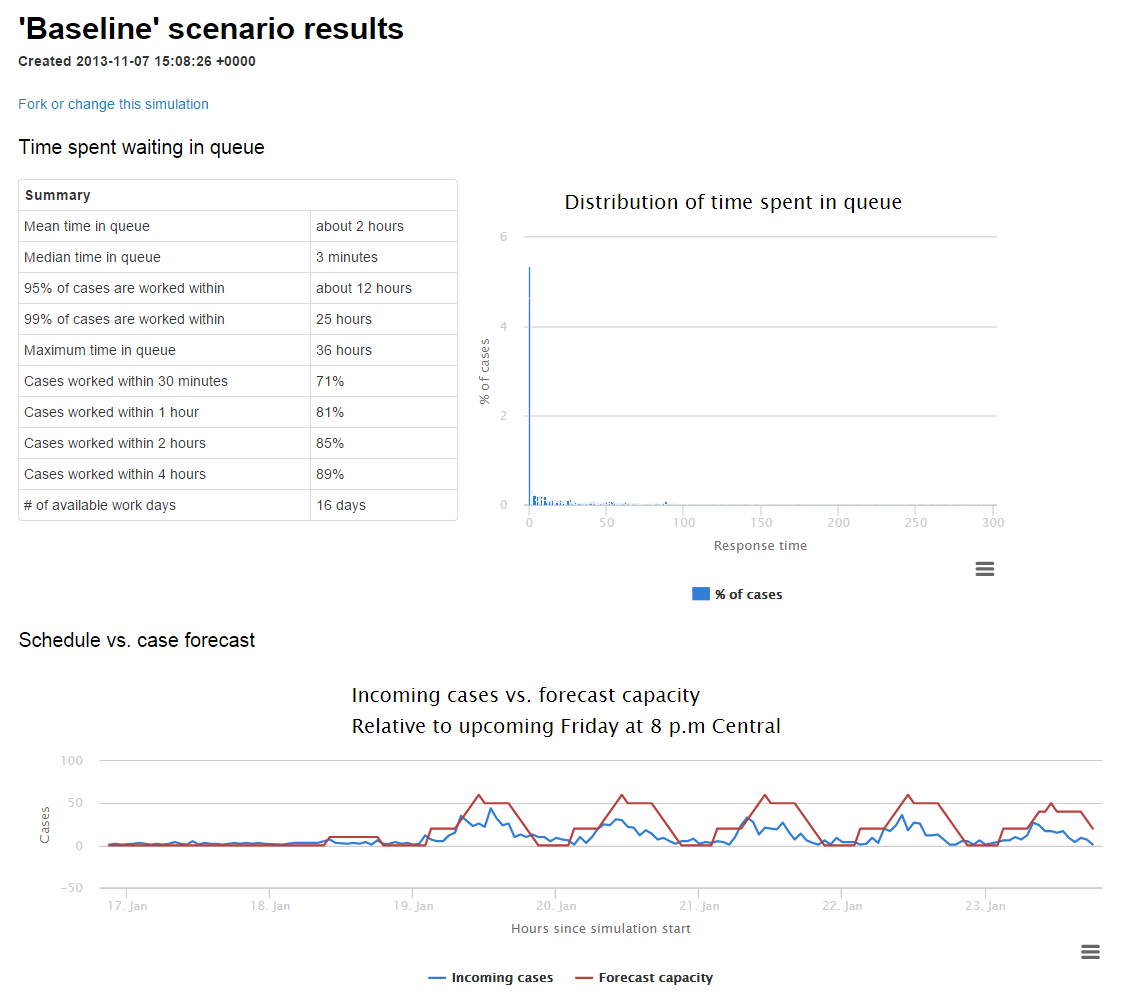
In the top left we see a summary of response time during the course of the simulation under that schedule. In this case:
- Median response time would actually be quite good, because we had coverage during the hours that most of our support cases were coming in.
- We were getting to 89% of cases within four hours, pretty far short of our goal.
- Max response time was 36 hours, which not coincidentally was our biggest gap without having anyone working.
We can also see the full distribution of response times over the course of the week, and where we’re keeping up with incoming cases vs. falling behind and building a backlog.
We ran a bunch of these scenarios when we started to talk about 24/7 coverage, including:
- Baseline: 89% answered in under 4 hours.
- From baseline, shifting one US Central timezone hours person to Tuesday through Saturday: 90% answered in under 4 hours.
- Baseline plus a Mon-Fri Australia/Asia team member: 94% answered in under 4 hours.
- Full 24/7 coverage, adding one person Weds-Sunday in each of the US, Europe, and Australia/Asia, and a Mon-Fri Australia/Asia team member: 100% answered in under 4 hours.
As Kristin explained in her post, this last scenario is what we ended up doing by bringing on JorDanée, Tony, James, and Sylvia.
But is it accurate?
This isn’t a perfect simulation — like any model, it relies on a number of assumptions. That said, it’s accurate enough to provide general guidance on what will happen with different schedules and team sizes.
The proof, of course, is in the pudding, and now that we’ve been running at 24/7 support for six months, it’s easy to compare our forecast to reality:
| Measure | November 2013 forecast | July-Dec 2014 actual |
| Median response time | 1 minute | 3 minutes |
| 95th percentile response time | 8 minutes | 21 minutes |
| 99th percentile response time | 23 minutes | 73 minutes |
| Max response time | <1 hour | about 16 hours |
| % answered in under 4 hours | 100% | 99.99% |
As you can see, we came pretty close to experiencing what we forecast we’d do when we first started talking about 24/7 support nearly 18 months ago. Why did we fall short? Mostly things we didn’t account for in the simulation—people take vacations or get sick, we work a slightly different schedule when we have our semi-annual company wide meetups, etc.
Did the simulation directly impact our hiring decisions? No, probably not — the easy answer of not having any gaps would have been enough for that. Did it give us a clearer sense of what would happen as we worked through expanding the team, and an expectation of what we should be shooting for? Definitely. Plus, I had a lot of fun naming something the Support Simulator 4000.
Tamal White
on 13 Jan 15I’m assuming you skipped using Erlang-C due to the small staff quantities and wanting to hand-craft schedules. Any other reasons?
This discussion is closed.