Since I joined 37signals, I have been working to improve our monitoring infrastructure. We use Nagios for the majority of our monitoring. Nagios is like an old Volvo – it might not be the prettiest or the fastest, but it’s easy to work on and it won’t leave you stranded.
To give you some context, in January 2009 we had 350 Nagios services. By September of 2010 that had grown to 797, and currently we are up to 7,566. In the process of growing that number, we have also drastically reduced the number of alerts that have escalated to page someone in the middle of the night. There have certainly been some bumps along the road to better monitoring, and in this post I hope to provide some insight into how we use Nagios and some helpful hints for folks out there who want to expand and improve their monitoring systems.
Like most things at 37signals, our Nagios environment is controlled by Chef. When new hosts are provisioned, they get added to our monitoring system automatically. A year or so ago, we were only automatically monitoring a handful of things on our hosts: disk use, load and memory.
Monitoring More
The first step to improving the situation was to install Check_MK. Check_MK is a Nagios plugin that automatically inventories hosts, gathers performance data and provides a nicer UI. With Check_MK, we now monitor about 20 metrics per host automatically; everything from postfix queues to open TCP connections is monitored. Check_MK also provides a very helpful backend, mk_livestatus, which allows you to query Nagios for real-time host and service information and to send commands to be processed. For example, we used Livestatus to train our friendly Campfire bot to acknowledge alerts and set downtime. Using Tally, almost all of our Nagios interactions now take place directly from a Campfire room.
We’ve also added a large amount of application-specific monitoring to Nagios over time – we track response time, error codes and various other metrics about our applications’ performance using statsd, as well as a range of MySQL, Redis, and Memcached statistics. These are all things we want to monitor before our customers notice a problem. These additional checks give us far more visibility into our operations than we had before, but they come at a cost: the performance of our Nagios installation and the host that it lives on has suffered as we’ve ramped up our monitoring.
The Problem
Nagios works well out of the box for a small to medium-sized installation, but we quickly ran into some limitations that caused us problems. First, it was taking 45 seconds from the time that a service was scheduled to be checked until Nagios had the resources to run the check. To reduce this latency, we enabled Large Installation Tweaks, which had an instant impact on our service latency, dropping to an average latency of less than 0.3 seconds. Unfortunately, it also had an instant impact to our monitoring host’s load – our high check latency had been effectively acting as a throttle on the number of checks that Nagios could execute at a given time. When we reduced that bottleneck, we saw load go from 5 to around 30 (our primary monitoring server runs on 2x Xeon E5530 processors).
Eventually, I decided that the load was getting out of control and went about trying to reduce it. Reducing the frequency of our check_mk agent checks had very little impact on load, but changing the timing of our other active checks to check half as often had a huge impact on load, dropping it from around 30 to under 10. This clearly demonstrated that active services were our enemy and must be eliminated at all costs.
A Short Primer on Nagios Services
- Active Services are checks defined by executable shell scripts that Nagios executes directly. The services are scheduled at defined intervals, placed into a scheduler and then executed when threads are available. Nagios must shell out, execute the check script, wait for results, parse those results, append the results to the command buffer and then process the result. During the entire check duration, the thread is held and cannot be used for anything else.
- Passive Services are checks that are triggered either by Nagios, like the check_mk agent checks, or another mechanism, but are not actively run by the Nagios server. When there are passive check results, the external process simply appends the results to the command buffer directly, where Nagios processes them like an active check result. Nagios does not schedule the checks or use resources to execute them, and so uses only a tiny fraction of the resources.
A large number of our active services were making an HTTP request to our internal dashboard application to get the application and database metrics mentioned previously. Rather than have Nagios actively check each of those, we decided to push updates from Statsd over websockets at regular intervals (using the very nice Slanger library). To do this, we generate a configuration file from Chef to determine which metrics are needed with what thresholds, and then a small daemon subscribes to those metrics and periodically sends check result data to Livestatus, which appends it to the command buffer for processing. We also supplemented these pushed checks that come from our dashboard with others that push directly from the check script.
Results
As expected, moving these services to be passive had a large impact on our Nagios CPU usage, as shown in the graphs below.
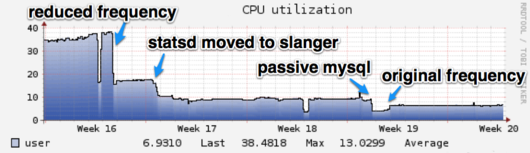
All in all, we have reduced the number of Active Services from around 1900 to 745. Most of the remaining checks have to be active – we want ping checks, Check_MK agents, and HTTP checks for applications to be active so they fail quickly and loudly.
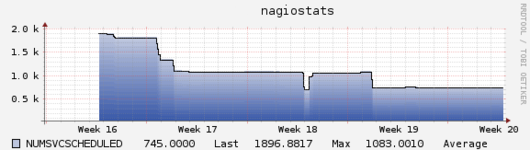
To some extent, this just shifts load—some of that load is now being incurred on other hosts, either from the check scripts or from the pusher daemon that sends the results to Nagios. While that’s beneficial in and of itself (we were able to spread load out to servers with more excess capacity), we also improved overall efficiency of the system by rewriting some check scripts and eliminating the overhead of thousands of HTTP requests. More importantly, we have restored our original check intervals and added some new monitoring while keeping load around 3 and latency under a half second.
I hope this gives you some sense of how we approached solving a problem with our monitoring infrastructure by taking a different approach than the conventional “add another executable script” way of monitoring, and perhaps gave you some ideas about how you can improve the performance of your own monitoring system.
paul sanwald
on 16 Aug 12this is a fantastic post. I’ve really been enjoying the posts on things that are seemingly day to day, but can make a big difference in how smoothly things run.
Monitoring is one of those things that is never going to be flashy, but really important for all of us dealing with production systems. thanks for sharing.
Drew Dara-Abrams
on 16 Aug 12FYI, the link to Tally is broken.
Brian Goff
on 16 Aug 12I’ve been using Nagios to monitor our edge devices as opposed to server infrastructure and have hooked this into our CMDB with a custom view layer built on RoR. We currently have 3600 monitored services. In addition to running into the same issues you listed we also have issues with poor notification logic (which is how we create tickets in the CMDB) and difficulty in managing configurations with just a single check server ( I don’t want to think about scaling this out to other servers ).
Have recently been mulling over writing custom code to replace Nagios, spread checks out onto the hosts that need to be checked, and relay messages back and forth with web sockets.
Gary
on 17 Aug 12Did you mean “page someone”, as in, your support guys have pagers, surely not?
We get SMS notifications from Nagios using this plugin
http://exchange.nagios.org/directory/Addons/Notifications/SMS/SMS-Notifications-via-Mediaburst/details
Carlos Fabbri
on 17 Aug 12Hi Eron,
Nice post and comments. Have you ever considered another monitoring solution as Zabbix?
It seems that it’s easier to implement and has lots of nice features.
Thanks,
Eron
on 17 Aug 12Drew – Thanks, I have fixed the link.
Brian/Gary – We use PagerDuty to take care of Notifications and On-Call Schedules. They are great. No, we do not carry actual pagers.
Carlos – Thanks! We have considered Zabbix in the past, but decided to fix the issues we’ve had with Nagios rather than switch.
Florian Heigl
on 17 Aug 12Hi,
Nice Nice article! I love how you sneak data back into Nagios using livestatus, did you also add some checks of your own? fancy publishing them? Tally sounds like something I wanna have a look at, too.
We also ran some benchmarks in the lab. They’re showing where Nagios can go (4000 hosts/min?), where it needs help to go(10000 hosts/min), and where it can’t go(10000hosts/second) or agents with limitless latency.
And @Brian “Have recently been mulling over writing custom code to replace Nagios, spread checks out onto the hosts that need to be checked, and relay messages back and forth with web sockets.” take out the websockets and roundtrips, make sure 1-rtt checks it all, then you have one of the very initial ideas in Check_MK :)
Ed
on 18 Aug 12Do 37signals uses New Relics at all?
Mike
on 20 Aug 12This is a great and informative article, thanks. I wanted to ask if you have had a chance to look into NRDS (Nagios Remote Data Sender) and what you think of it? There is also NRDS WIN for windows. There passive agents recently developed at Nagios.
Philippe Creux
on 21 Aug 12Great post!
Do you guys use the basic dashboards which comes with Nagios, a plugin or something home-made? :)
Andreas Ericsson
on 21 Aug 12Hi there. I’m one of the Nagios maintainers. I’d just like to plug Nagios 4 (latest SVN trunk at the moment, scheduled for stable release at end of september), which fixes the issues you mention here.
The high load when running active service checks was primarily caused by three things: Spooling of all checkresults to disk, unnecessary number of fork() calls per check executed and a scheduling queue with O(n) insertion performance. With Nagios 4, we no longer hit the disk thrice for each executed check, the scheduling queue is O(n lg n) (min-heap priority queue) and assuming you have no output redirection or shell-ish jobcontrol in your checks, we execute exactly one fork per external command to run.
If you have some spare time to test it, please let me know how it goes. If you find and report any bugs, expect them to be fixed by mid september. Especially if you supply a patch with the bugreport ;-) I’d be happy to help with migration if you run into any problems.
@Florian; I think you mean “checks / min”, as “hosts / min” is an extremely inexact metric. Try Nagios 4 and see where you hit the limit with that one.
Học kế toán
on 21 Aug 12I also hope the issue concerns all help. Thank you very much.
Dominik
on 22 Aug 12great post, great story!
Moses Gone
on 22 Aug 12Thanks for the nice piece. I was wondering….can I have nagios triggering a java application. I have a java app that has to run every midnight. We would like nagios to be the trigger. Is this possible?
Florian Heigl
on 22 Aug 12Hi Andreas :))
I used hosts/min for a reason, as most people care about that more than the services. In testing I had made fake hosts with 40 services each, so 10k hosts equals 400k services. That’s in a mix between passive (30) and active checks (10). In OMD setups the (damned) check result files go to a ramdisk, so we never touch the disk for normal operation, but the forking is a much bigger limit. I’ve had one system where memory troughput went up to the 30GB/s range during testing. :)
I’m personally looking forward to faster check submission (the nagios3 limit with ramdisk+files was around 1500/s) and the quicker scheduler.
I’m also looking forward to doing Nagios4 benchmarks, but it used up many of my weekends to do the last runs and I won’t be doing it will winter for the excess server heat. Testing on smaller boxes just didn’t cut it. I’d never have thought Nagios would crush ANY hypervisor if you run 20 Nagios instances in parallel. :)
This discussion is closed.