Andrew Mason’s talk at Startup School 2010 included a slide that really blew my mind. The slide wasn’t about Groupon (Andrew’s company), it was about Meetup.com.
Andrew heard Scott Heiferman (CEO of Meetup.com) describe the initial version of Meetup.com as a matrix of cities and interests. He put it in spreadsheet format and here’s how it came out:
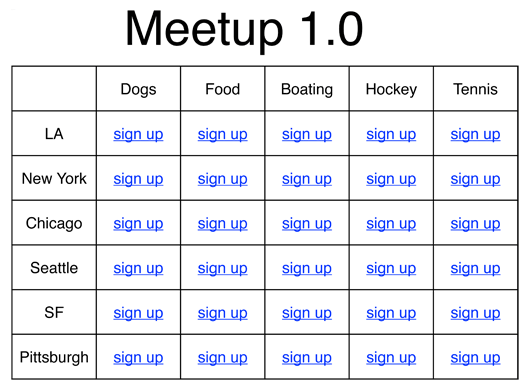
It doesn’t matter how many rows or columns – it works at all scales. It’s such a simple representation of what is ultimately a simple idea (meeting up with people in your city who share a similar interest), but it could just as easily been diagrammed in a complex way.
I’ve come back to this slide over and over for inspiration when thinking about new concepts or product ideas. It’s a great exercise in clarity. Can I boil down the idea into something as simple as a column and a row?
MattH
on 13 Dec 10Very cool.
Pittsburgh never struck me as much of a Tennis town.
Vladimir
on 13 Dec 10Not so bad, but some time ago I’ve implemented a bit more easy to use thing (on my minf, of course). Primarily I talk about good highlighting of the current selection, which is especially useful with big tables. Just skip the meaning (signing up or viewing prices, no difference) – look at the example: http://eunear.me/pricing
(It’s not an advertising 100%, cause the project, represented by the site eunear.me, doesn’t exist now).
phlux
on 13 Dec 10Here is one example of how I use Excel to visually convey information about complex systems on a daily basis.
http://i.imgur.com/FdYVB.png
With these, we use various views to convey the information in a layered format – meaning we step through the problems with many representations to make it understandable to those not familiar with the systems/technologies etc… but are the key decision makers with respect to approval/budget/design.
In this case, we are documenting the integrations and dependencies of a range of technologies communicating over a common converged network.
I try to evolve these diagrams each time as everyone becomes more familiar with the project specifics and the over-arching language of the design.
Generally speaking, the blue squares represent work/cost/effort/support/design is needed to get the desired functionality.
This helps capture the real amount of effort and work to make an entire system function.
Jimi
on 14 Dec 10This is really awesome!
Scott
on 14 Dec 10I think phlux was the inventor of Tetris!
Pete
on 14 Dec 10Nice talk. I like how Groupon was a by-product of another project.
Dan
on 14 Dec 10I don’t see how this scales well… take a look at the metro areas listed on Craiglist, and then re-imagine the slide with all of those areas and another 10-20 hobbies. The only way it scales is if you believe that people love scrolling.
Seems like Craiglist has it figured out – for 99.9999% of my life (the part where I’m not planning to move to another city), I don’t need to see links from other areas. That is a 1.0 site that continues to have impact.
maus~
on 14 Dec 10The concept looks great at first, but I can only imagine the visitor trying to figure out if she loves food as much as or more than dogs.
Anonymous Coward
on 14 Dec 10maus, it’s not a web site design.
Kevin Haggerty
on 14 Dec 10Great slide – agreed, not a web design, but it’s a strong idea and well-executed, and communicates the idea quickly. Would be an interesting starting point for a web design.
Dripping with Sarcasm
on 14 Dec 10How profound.
And let me guess, tic-tack-toe is the best strategy game you’ve ever played?
David
on 16 Dec 10What? This isn’t clever nor good.
Obviously if you have only two parameters to choose you can make a table/spreadsheet/matrix (same thing) of it. This is a “new concept”? “Inspiration”? What???
And it doesn’t scale well at all! This barely works with a few tens of cities. You can’t make a table with thousands of rows or columns. If they try to make it work for every city it becomes stupid.
Lastly, while it may be a decent idea for some other 2 parameter choice, this is an awful design for the purpose of meetup. The user is only interested in his own location, isn’t it smarter to ask the user what city he is from (preferably with auto-complete box or multiple selection) and what interests him? Why does he need to see other cities covering his screen?
Cesare
on 16 Dec 10I might have already subscribed to some combination, so I’d put something to show such a difference (subscribed or not). For the rest the design is very clear.
Nicolas
on 16 Dec 10In fact, it appears to be like a “BI” classical view.
Then you can apply the classical approach of BI.
Let say your have N axes like location, Date/Time, activity or what ever.
Each axe has several lvl of detail like the state for the first lvl, the city for the second lvl and the local area for the third.
For the activity you have again several lvl. 1 lvl is activity type like sports, Pets or Food. Lvl 2 for sports would be a list of sport type, lvl 3 list of sports.
The you have a BI like view of all the possibilities where you can navigate on any axes at any arbitrar lvl.
In any case, i see the basic idea to be very great and provide a good UI.
JF
on 16 Dec 10For those commenting on this as if it was a web design, it’s not. It’s not meant to be used by anyone. It’s a visual representation of the Meetup.com concept distilled down into columns and rows. It’s purely for internal display, not for customers to see, use, or otherwise experience.
This discussion is closed.