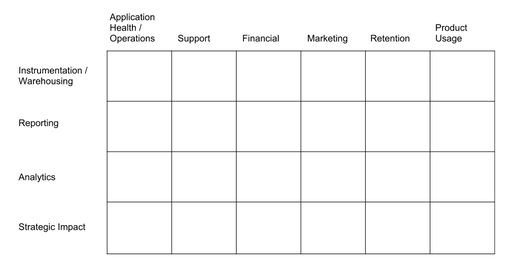
One way I like to think about the different aspects of “business intelligence” is as an organizational scorecard. It helps to maintain a mental model of what you’re doing and why when prioritizing investments of time or money.
On this scorecard, the rows represent analytical competencies of growing sophistication from top to bottom. I classify these competencies as:
- Instrumentation / Warehousing – can you measure things, and can you store that data in a clean, retrievable format?
- Reporting – can you get the data out of your warehouse and into the hands of people who can use it?
- Analytics – can you add value to raw data with analytics, benchmarks, etc.?
- Strategic Impact – do the results of your data and analysis impact the direction of the organization in a meaningful, accretive way?
The columns represent different functional areas of relevance to your organization. For our purposes, I use ‘Application Health/Ops’, ‘Support’, ‘Financial’, ‘Marketing’, ‘Retention’, and ‘Product Usage’. This taxonomy isn’t completely clean, and there’s some overlap, but they’re roughly distinct areas.
When you draw this grid out, you end up with something that looks like the below.
I’ve drawn my columns in what I generally think of as increasing long-term strategic importance. Every column on here is critically important, but our long-term success comes from people getting value from using our products, and so I put that at the far right. You could make an argument for ordering them differently, but the general idea is the same.
My aspiration is always to spend most of my time and energy in the bottom right few boxes—doing analytics and having impact on things like retention and usage.
The reality is that in order for those to matter at all, you have to have rock solid instrumentation and reporting across the board, and some of the functional areas on the left side of the chart are more pressing – if your applications are falling over and you don’t know why, or your team is buried under thousands and thousands of support tickets, all the wonderful analytics in the world on usage probably won’t keep your company heading in the right direction.
Take a minute and give your organization a letter grade in each of these boxes. Think about what you would have given yourself in each box a year or two ago, and where you’d like to be a year or two from now. Have you made progress? Do you still have work to do?


David Andersen
on 12 Sep 12It’s a good taxonomy. I’d split Instrumentation / Warehousing because responsibility for success in each almost always fall into different hands. Instrumentation is a problem at every customer I’ve ever had. Most primary systems (transactional/operational systems) are not designed with measurement in mind so there is always a gap, much to the frustration of every downstream data consumer.
AC
on 12 Sep 12I really feel bad for Noah.
I obviously spends a lot of time writing his blog post but no one ever write a comment on his posts.
Michael
on 12 Sep 12Why would you feel bad for an R-using badass?
eduardo
on 12 Sep 12Contrary to AC, I would like to say that Noah’s post offer great insight for me. Comments or no comments.
Ellen Watson
on 12 Sep 12I’m going to forward this to my boss, who is a champion of supporting business decisions with data, and is helping us build the tools to do it. Thank you.
(BTW, Noah, “our your team” should be “or your team”.)
Matt
on 12 Sep 12Hmm. Am I in the right place? I must have missed this chapter of Getting Real.
Timm
on 13 Sep 12Hi Noah! What do you think about a column “employees”?
Addis
on 16 Sep 12This post is so timely to me Noah. I struggle daily/ hourly with finding the balance between doing what I know needs to be done from a data warehousing perspective and the pressure to “just show something.”. Ultimately it’s a loosing proposition either way because if I just show something but it’s then I don’t have the data for follow up questions or performance is bad or security is not scalable will memories recall that this was what they asked for? I will try to apply the scorecard theory over the coming weeks and see if it makes an angle in everyone’s head. Thanks!
deep
on 18 Sep 12Heya are using Wordpress for your blog platform? I’m new to the blog world but I’m trying to get started and set up my own. Do you need any coding knowledge to make your own blog? Any help would be greatly appreciated!
This discussion is closed.