
Since we launched a public window on Smiley a few weeks ago, over 20,000 people have visited it to see how we’re doing against our goal of making customers happy, not just satisfied.
I recently took a look at responses to Smiley since we started using it last fall. The whole point of exposing Smiley publicly was to encourage transparency, and I’d like to continue that by sharing the same results I shared with everyone here. I’ll give the results first; for those of you interested in the “how”, I’ll share details at the end.
What we’re learning from Smiley
About 30% of people who write to support end up rating our response. We’re very happy with 30% – that’s quite high for a completely optional survey.
Across all of those responses, our report card looks like this:
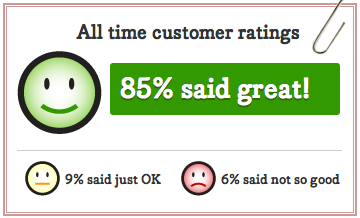
In my mind, the key metric is really the portion that said their interaction was great. If someone said it was just ok or if they said not so good, those both indicate something we could be doing differently.
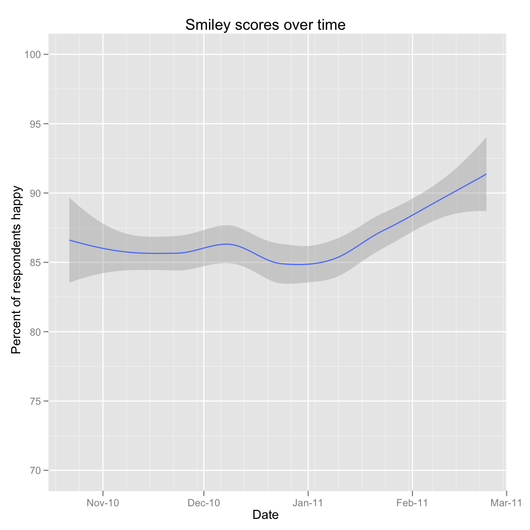
I dug a little deeper to understand how happiness varies:
- More people rated their interaction as “great” in 2011 than 2010 (87% vs 83%). This has been climbing over the last two months as well.
- People whose tickets are fully resolved within a day of submitting them are more likely to be happy than those that took longer (87% vs. 81%; in the last six months, we’ve resolved 84% of our tickets within a day of submission, including weekends).
- Happiness is pretty consistent across products – ranging from a low of 83% saying great to a high of 86%
- Happiness doesn’t vary much by the specific plan someone is on. Elite Suite customers are just as happy as customers using a free version.
Aside from rating the experience great, ok, or not so good, we allow people to leave open ended comments. 59% of people have ended up leaving comments so far. I decided to take a look at what people are saying:
The average comment is 12 words. The most common words people used in their responses were: quick, thanks, answer, fast, friendly, problem, question, reply, time, great, clear, helpful, issue, support, service, prompt, good, solution, feature, solved, and timely.
I also took a special look at the written comments of people who weren’t happy with their support interaction. More of these people wrote comments (63%) and their comments were twice as long as average. Their comments connect well with what we suspected – people appreciate getting clear answers right away, and when we aren’t able to make someone happy, it’s often because of a feature request that we aren’t able to commit to immediately.
We’re happy to see happiness increasing over time, and have a bunch of ideas in the works to keep boosting this. I hope you keep watching with us at the 37signals Customer Support Happiness Report.
If you’re curious how I did this analysis, read on…
Behind the scenes: How I did this analysis
I started out pulling data from Smiley’s database, pulling the data into R using a MySQL query and a helper function that wraps a connection to our database servers:
smileys <- .productionq("smiley", "SELECT * FROM comments WHERE ticket_type=\"assistly\";")
This gave me 5,714 responses to examine further. I cleaned up the data a little bit – converted strings to dates and created an “is_unhappy” variable.
To get the portion of responses that are happy in 2010, I used the following, which sums up the number that were unhappy as a fraction of the total that responded in 2010 (there are a dozen ways you can do this in R, but this is the way that feels most natural to me).
happy2010 <- 1 - sum(smileys$is_unhappy[smileys$created_at$year == 2010]) / length(smileys$is_unhappy[smileys$created_at$year == 2010])
I also ran some lexical analysis on the comments we received using a couple of functions I wrote to do this. clean() strips out punctuation, special characters, etc. from the input and tokenizes it. counter() counts the frequency of strings of whatever length you specify. I counted the most common single words, two word phrases, and three word phrases.
comments <- clean(smileys$body)
singles <- counter(comments, 1)
doubles < counter(comments, 2)
triples <- counter(comments,3)
Now I wanted to get data from Assistly (our ticket system) to provide information about the request. The Assistly API uses OAuth, and there isn’t (to my knowledge) an existing OAuth library for R, so I decided the fastest way would be to use their assistlyapi command line tool and access it through R’s system() command.
I wrote a helper function to get a specific case given a ticket ID:
GetCase <- function(id) {
    case<- fromJSON(system(paste("/assistlyapi \"/api/v1/cases.json?case_id=", id, "\" --host 37s.assistly.com", sep=""), intern=TRUE))
    return(case)
}
Then I just ran a loop to pull ticket information for all smiley responses. When this was done, I’d added fields for customer id, account url, number of emails in the ticket, open time, and labels to my smileys dataset. Now I could look at happiness by open time and number of emails using the same approach as I used for 2010 vs. 2011.
The last thing I wanted to add to this was information about the account the request was related to so I could look at happiness by product and plan. To do this, I needed to look up the account in Queenbee, our billing/account system. The easiest way to do this was to look it up by the account URL we ask for on help requests, by splitting that into the subdomain that identifies the account and the domain that identifies the product:
smileys$url <- gsub("http://", "", smileys$url)
smileys$url <- gsub("https://", "", smileys$url)
for(i in smileys$url) {
    smileys$subdomain[i] <- strsplit(i, "\\.")[[1]][1]
    smileys$domain[i] <- strsplit(i, "\\.")[[1]][2]
}
Then, all I needed to do was pull account and subscription info for those subdomains:
temp <- subset(smileys, smileys$product=="basecamp")
for(i in temp$subdomain)
    subdomains <- paste(subdomains, " OR subdomain = \"", i, "\"", sep="")
accounts.bc <- .production("queenbee", paste("SELECT accounts.*, subscriptions.* FROM accounts LEFT JOIN subscriptions on subscriptions.id = accounts.subscription_id WHERE product_name = \"basecamp\" AND (", subdomains, ");",sep=""))
I did lose about a quarter of my sample in this step because they either didn’t have a subdomain or it didn’t match up properly (typos, etc.). This isn’t ideal, but is about as good as I’ve been able to get by the other method available, matching by email address (since people have different email addresses than the one we have listed for the account, etc.). Human generated data is messy.
Now that I had account fields, I could use the same technique to get happiness for a given plan.
And that’s all there was to it. This wasn’t a particularly lengthy or difficult analysis to do – most of the elapsed time was waiting for cases to download via the Assistly API.
Don Schenck
on 24 Feb 11So Sarah leaves and your rating climbs??!! . . . . . . I’M JOKING!!!
joe larson
on 24 Feb 11This is cool. You should fix the copy on your summary block. It should not say “N said just OK” and “N said not so good”. It should say “N% said just OK” and “N% said not so good”, because these do appear to be percentages. Otherwise I definitely first assumed that you really meant only 9 users said just Ok and 6 users said not so good. 9% and 9 users are very different things… I know you are just trying to simplify and save space but in this case it miscommunicates. Thanks
JF
on 24 Feb 11Joe: Yeah, you’re right. The summary block on the actual Smiley site lists the #s out of the last 100 responses, so # or % are the same. That design was reused for this post, but it’s over thousands of responses so not using % is confusing.
Wagz
on 24 Feb 11Thanks for this post, it’s a really nice overview of the steps you took with R and MySQL to pull together a really cool data visualization.
What is your advice to the team at 37signals based on the data? How do you turn the data into actionable data with your analysis?
Also, I’m wondering how you feel about significance being in a smaller company – is a single digit swing in 3-point rating scale with a sample of less than 5000 responses enough to actually read siginifigance, escpially after you segment the data by plan, by time to close a ticket, etc.?
I’m interested in your philosophy for how much attention you pay to such issues, since you can head down the wrong tracks by overvaluing data analysis on small samples.
Thanks, keep up the good work!
Igwe
on 24 Feb 11thanks for this noah. More articles on real world analytics please
Tanner
on 24 Feb 11This is great, if more companies took the time to invest in customer response/feedback in a way like this then I imagine we would see a lot more positive growth in companies that matter.
How do you plan to expand on Smiley, or is the plan to just keep it as is for now?
Jed
on 24 Feb 11How did you generate that graph?
NL
on 24 Feb 11@Wagz: I look both for statistical significance (the things I called out as different above are) and “meaningful” – is it a big enough difference to justify thinking about doing something related to it? A 4% increase in happiness over six months is both. A 1% difference in happiness between Highrise and Basecamp really isn’t – there isn’t a ton of insight I get from that.
Relying on statistical significance alone is risky, because at some sample size every difference becomes significant. That doesn’t mean it matters though.
@Jed – I used ggplot to make that. Speciifically, that’s using the default geom_smooth() parameters with some scaling added.
Jed
on 24 Feb 11Thanks Noah! I’m planning to learn ggplot SOON.
Dina Amadril
on 24 Feb 11Any plans on making smiley an app customers can use? We would buy it!
Evan
on 24 Feb 11This is fascinating – I was wondering how you embedded this in email in a way that got a 30% response rate?
JF
on 24 Feb 11Evan: We made it dead simple – click one of three big images at the bottom of an email. That’s the best way to get significant response. Remove effort.
jack
on 25 Feb 11Thanks Noah i am interested to learn
Alex
on 26 Feb 11Is this “analysis”? Or a list of descriptive statistics?
JF
on 26 Feb 11Alex: We use statistics and other statistics and observed trends for analysis. We’ve changed the way we do customer support because of what we’ve discovered with Smiley.
Hadley Wickham
on 28 Feb 11Tiny r hint: mean is sum over length, so a mean of a logical variable is the proportion of trues.
Cool that you guys are using r and ggplot2!
This discussion is closed.