One of the key strategies we use to keep the new Basecamp as fast as possible is extensive caching, primarily using the “Russian doll” approach that David wrote about last year. We stuffed a few servers full of RAM and started filling up memcached1 instances.
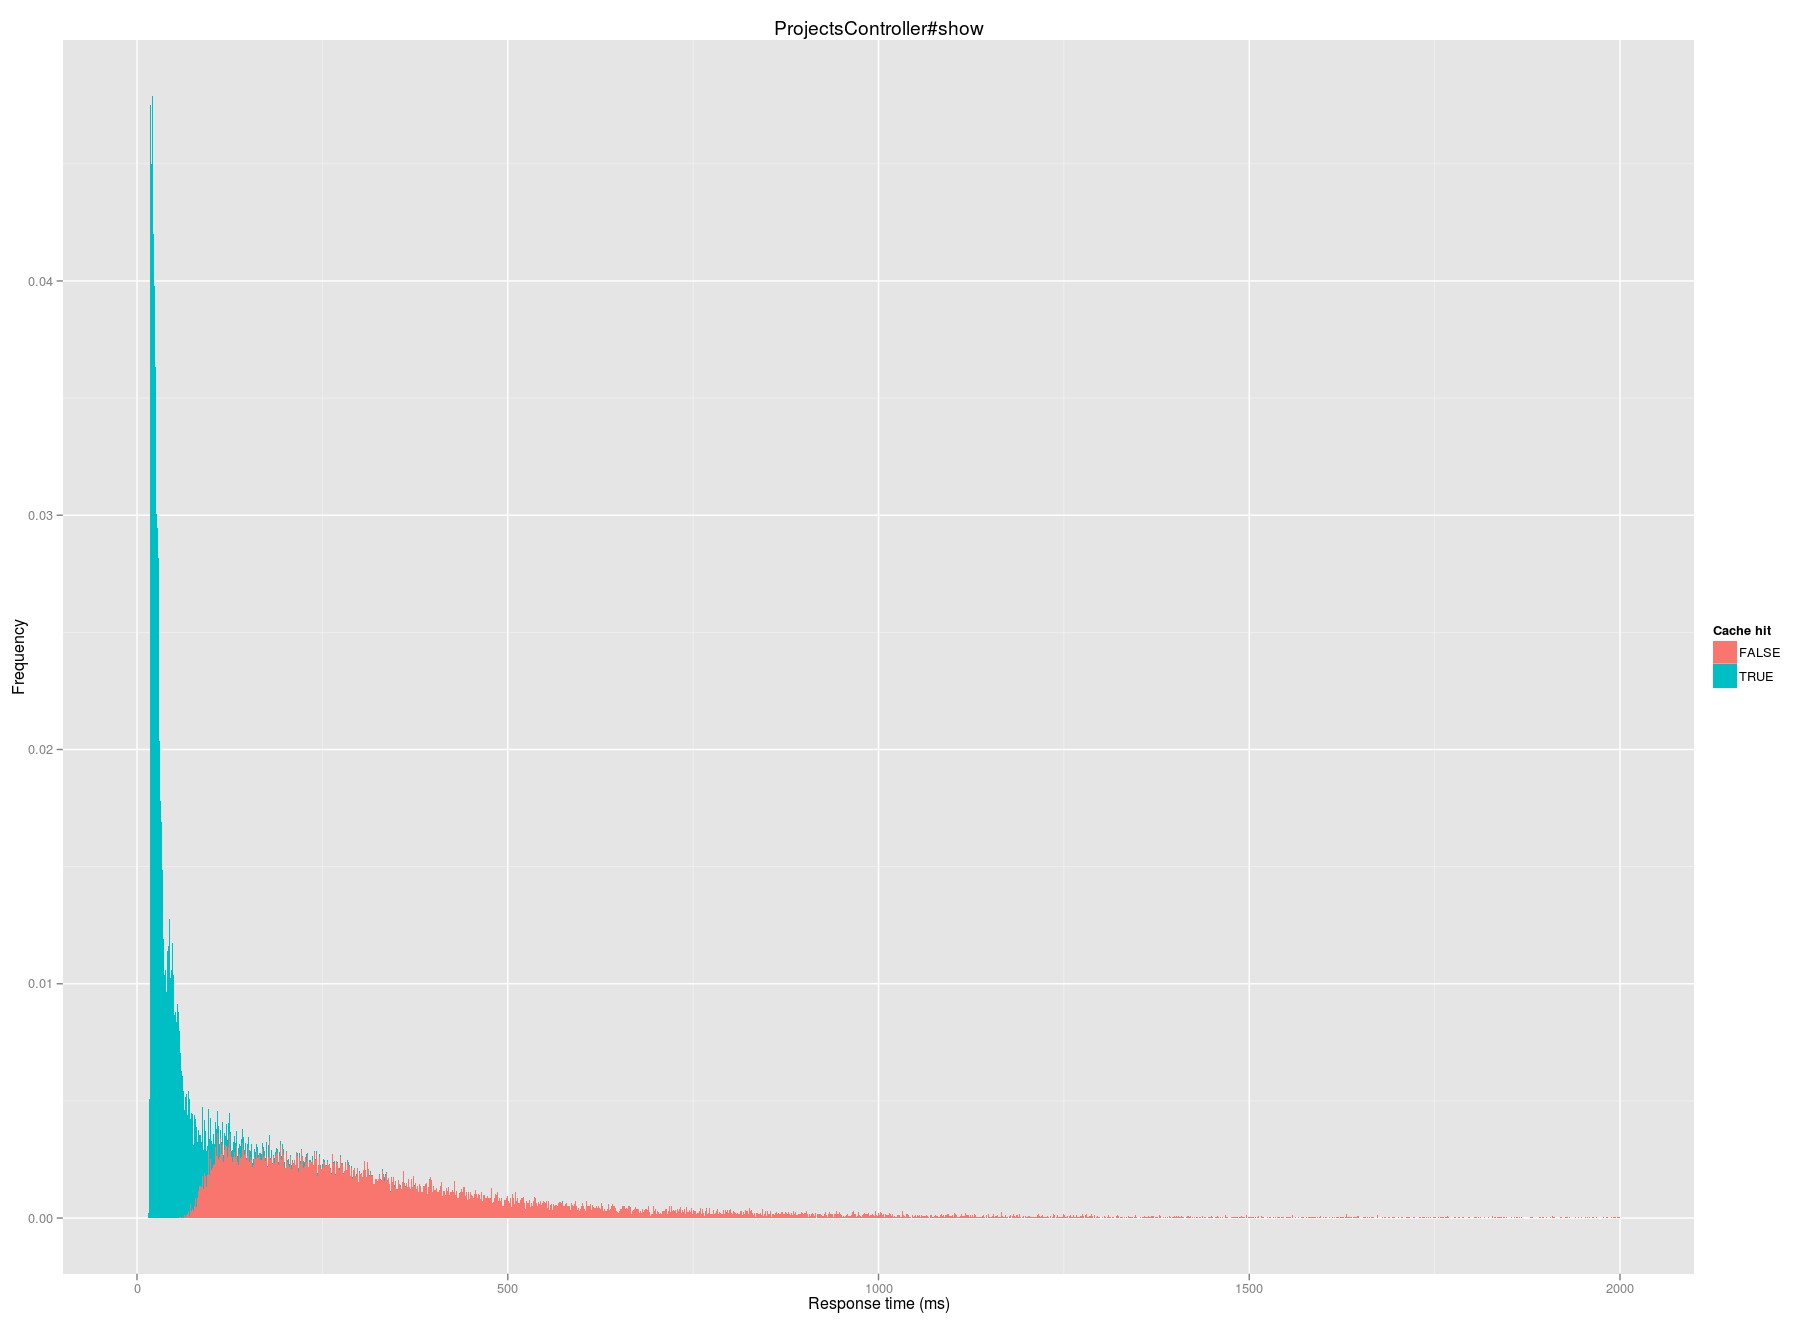
A few times in the last two years we’ve invalidated large swaths of cache or restarted memcached processes, and observed that our aggregate response time increases by 30-75%, depending on the amount of invalidation and the time of day. We then see caches refill and response times return to normal within a few hours. On a day-to-day basis, caching is incredibly important to page load times too. For example, look at the distribution of response time for the overview page of a project in the case of a cache hit (blue) or a miss (pink):
 Median request time on a cache hit is 31 milliseconds; on a miss it jumps to 287 milliseconds.
Until recently, we’ve never taken a really in-depth look at the performance impact of caching on a granular level. In particular, I’ve long had a hypothesis that there are parts of the application where we are overcaching; I believed that there are likely places where caching is doing more harm than good.
Hit rate: just the starting point
From the memcached instances themselves (using memcache-top), we know we achieve roughly a 67% hit rate: roughly two out of every three requests we make to the caching server has a valid fragment to return. By parsing2 Rails logs, we can break apart this overall hit rate into a hit rate for each piece of cached content.
Unsurprisingly, there’s a wide range of hit rates for different fragments. At the top of the heap, cache keys like views/projects/?/index_card/people/?3 have a 98.5% hit rate. These fragments represent the portion of a project “card” that contains the faces of people on the project:

This fragment has a high hit rate in large part because it’s rarely updated—we only “bust” the cache when someone is added or removed from a project or some other permissions change is made, which are relatively infrequent events.
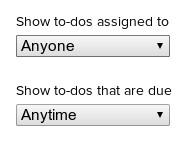
At the other end of cache performance with a 0.5% hit rate are views/projects/?/todolists/filter/? fragments, which represent the filters available on the side of a projects full listing of todos:

Because these filters are based on who is on a project and what todos are due when, the cache here is busted every time project access or any todo is updated. As a result, we rarely have a cached fragment available here, and 99 times out of 100 we end up rendering the fragment from scratch.
Hit rate is a great starting point for figuring out what caching is likely effective and what isn’t, but it doesn’t tell the whole story. Caching isn’t free – memcached is blazingly fast, but you still incur some overhead with every cache request whether you get a hit or a miss. That means that a cache fragment with a low hit rate that is also quick to render on a miss might be better off not being cached at all — the costs of all of the misses (the fruitless memcache request) outweigh the benefits of a hit. Conversely, a low hit rate isn’t always bad—a template that is extremely slow to render might still benefit on net even if only 10% of cache requests are successful.
Calculating net cache impact
Calculating the net impact of a given piece of caching is conceptually simple:

In practice, you need to know a few things to actually calculate the net benefit of a given cache fragment:
- The mapping between a cache fragment and the template that is rendered in the event of a miss.
- The elapsed time to render each template.
- Each cache request made, whether it was a hit or a miss, and the elapsed time.
- The ability to link #2 and #3 for a given request (e.g., a unique request identifier)
Fortunately, this data is relatively easy to come by. Mapping cache fragments and impacted templates is relatively straightforward with a little bit of knowledge about your application. All of the other data can come from parsing Rails logs, which since Rails 3.2 have carried the ability to tag your logs with a unique identifier which will let you tie together cache hits/misses and template rendering times.
As an example, let’s take the fragment views/projects/?/index_card/people/? that provides the faces on project cards. That fragment maps to the projects/_project_cards.html.erb template in Basecamp. That template includes more than just that fragment, but that’s the only cached fragment in that template, so we have a pretty clear one-to-one mapping available.
As mentioned previously, the hit rate for this fragment comes in at 98.5%. From Rails logs, each cache miss takes 0.6 milliseconds, rendering the template on a miss takes 140 milliseconds, and rendering on a hit takes 53 milliseconds. Working through the formula above, you end up with a weighted benefit of 87 milliseconds from this use of caching.
There are over a hundred distinct types of cache keys in Basecamp, but 50 of them comprise 83% of cache activity. For each of these families of cache keys, I performed the above calculation. Ultimately, my hypothesis was largely disproved: 90% of the analyzed cache keys have a net positive impact on request time, improving response time by an average of 71 milliseconds. That does leave a handful of cache keys that aren’t net positive, but the negative impact of them is extremely modest, adding less than a millisecond to impacted requests.
The ranking of cache fragments further demonstrates the places where caching is particularly helpful. Across the entire application, the part that benefits most from caching is the listing of discussions on a project’s overview page:

A cache hit here saves an average of over 400 milliseconds when compared to a miss. The degree of benefit here isn’t surprising—rendering this list of topics requires either a large set of further cache requests (for each individual entry) or a number of queries to render the discussion item, the people involved, the comments, etc.
On the flip side, the worst fragment across the entire application is the todolist filter described earlier. Precisely because the hit rate is so low, and because it only saves about 20 milliseconds in those rare cases it does get a hit, it ends up adding about half a millisecond to requests for the todolist index of a project.
Limitations and putting it into practice
The biggest limitation of this analysis is that it is entirely retrospective and based on existing caching: it can tell you what caching you already have is working for you, but it can’t tell you what you’re missing.
Not finding any big negative impacts of caching is a bit of a good news/bad news situation. On the one hand, it turns out we’re caching relatively intelligently: our use of caching is net positive in a significant way. On the other hand, that also means that there are no magic rabbits to pull out of our hat – we can’t turn off caching on one fragment and instantly see page load times plummet.
While we have no smoking guns to fix this time, we want to be sure that we don’t inadvertently introduce any caching related slowdowns in the future, so we’ll regularly monitor fragment performance and make adjustments accordingly.
Caching is just one of the ways that we’re constantly working to make Basecamp as fast as possible. Want to see how fast Basecamp is? Try it yourself!
- For a great look at memcached use at an entirely different scale, a great paper is Scaling Memcache at Facebook.
- The key enabler for this analysis is that we now parse and store all our Rails logs in HDFS. I wrote about our early experiments with this last year.
- The cache fragment directly from Rails will actually look like
views/projects/2183566-20131118195306000000000/index_card/people/0f11973c5bb52b10b0274b9fcfcb35a. In order to analyze like fragments, we remove all of the project or account specific parts of the cache key for this analysis.

cpuguy83
on 25 Nov 13Would also be quite helpful if Rails’s cache fetcher supported asking for multiple keys at once (i.e., Dalli’s get_multi)
JT
on 25 Nov 13How long do you guys keep your application logs around?
Nate
on 25 Nov 13cpuguy83, I have an open source gem that adds multi fetching for a collection of cached partials. Is that what you’re looking for?
https://github.com/n8/multi_fetch_fragments
cpuguy83
on 25 Nov 13Nate, Yes. I have contributed to it.
Matt De Leon
on 30 Nov 13Noah, great write up. Not too often we get this scientific of an insight into web dev. Two quick questions:
1) What does “rendering time on a cache hit” mean? (In your example, it was 53ms for project_cards). On a cache hit, isn’t only memcache being touched, and so shouldn’t the time be less a few ms?
2) My head starts to spin whenever I think too deeply into these things, but is the 53ms to render a cache hit a mean rendering time? If so does it have a large standard deviation?
Noah
on 02 Dec 13@JT – two weeks.
@Matt – re: rendering time—you’re right, if you had a partial that was entirely cached the time would just be the memcache hit and a little bit of overhead. In this case, we have a single partial that represents the entire project card, and only cache the set of avatars. The rest of the card (project name and description, updated time, etc.) still has to be rendered.
Yep, that’s a mean rendering time. I don’t have the actual standard deviation handy, but it certainly has a meaningful one. If we could accurately predict how long a given request could take (perhaps based on project size), we could make better choices about when to cache on an account-by-account basis, but that ends up being pretty complex, so aiming for best aggregate performance across all accounts and projects is the practical way to optimize this.
GeeIWonder
on 02 Dec 13I don’t have the actual standard deviation handy, but it certainly has a meaningful one.
I don’t understand this statement.
This discussion is closed.