
Behind the Scenes posts take you inside Basecamp for a look at an aspect of how our products are built and run.
In our quest to make Basecamp as fast as possible for users all around the world, we recently decided to elevate awareness of page load performance for staff users. We wanted speed to be something we always think about, so for the last couple of months Basecamp staff have been seeing a little something extra when they’re logged in to Basecamp: “Oracle”, our performance widget.
Oracle uses the Navigation Timing and Resource Timing APIs that are implemented in most browsers to track how many requests are made in the course of loading a page, how long the page takes to load, how much time was spent waiting for the first byte of content to be received vs. parsing and loading scripts and styles, and how much time was actually spent processing the request within Rails itself. On browsers that don’t support those APIs, we degrade gracefully to present as much information as possible.
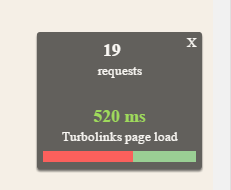
Mobile staff users don’t miss out on the fun—we include a stripped down version of the widget at the bottom of every page:

If you need Oracle out of the way you can drag it wherever you want, or just minimize it into a little logo in the bottom corner of the page:

This data for staff users is sent up to our internal dashboard, which enables us to diagnose slow page loads in more detail. When staff click on the toolbar after a slow page load, they load a page in our dashboard that looks like this:
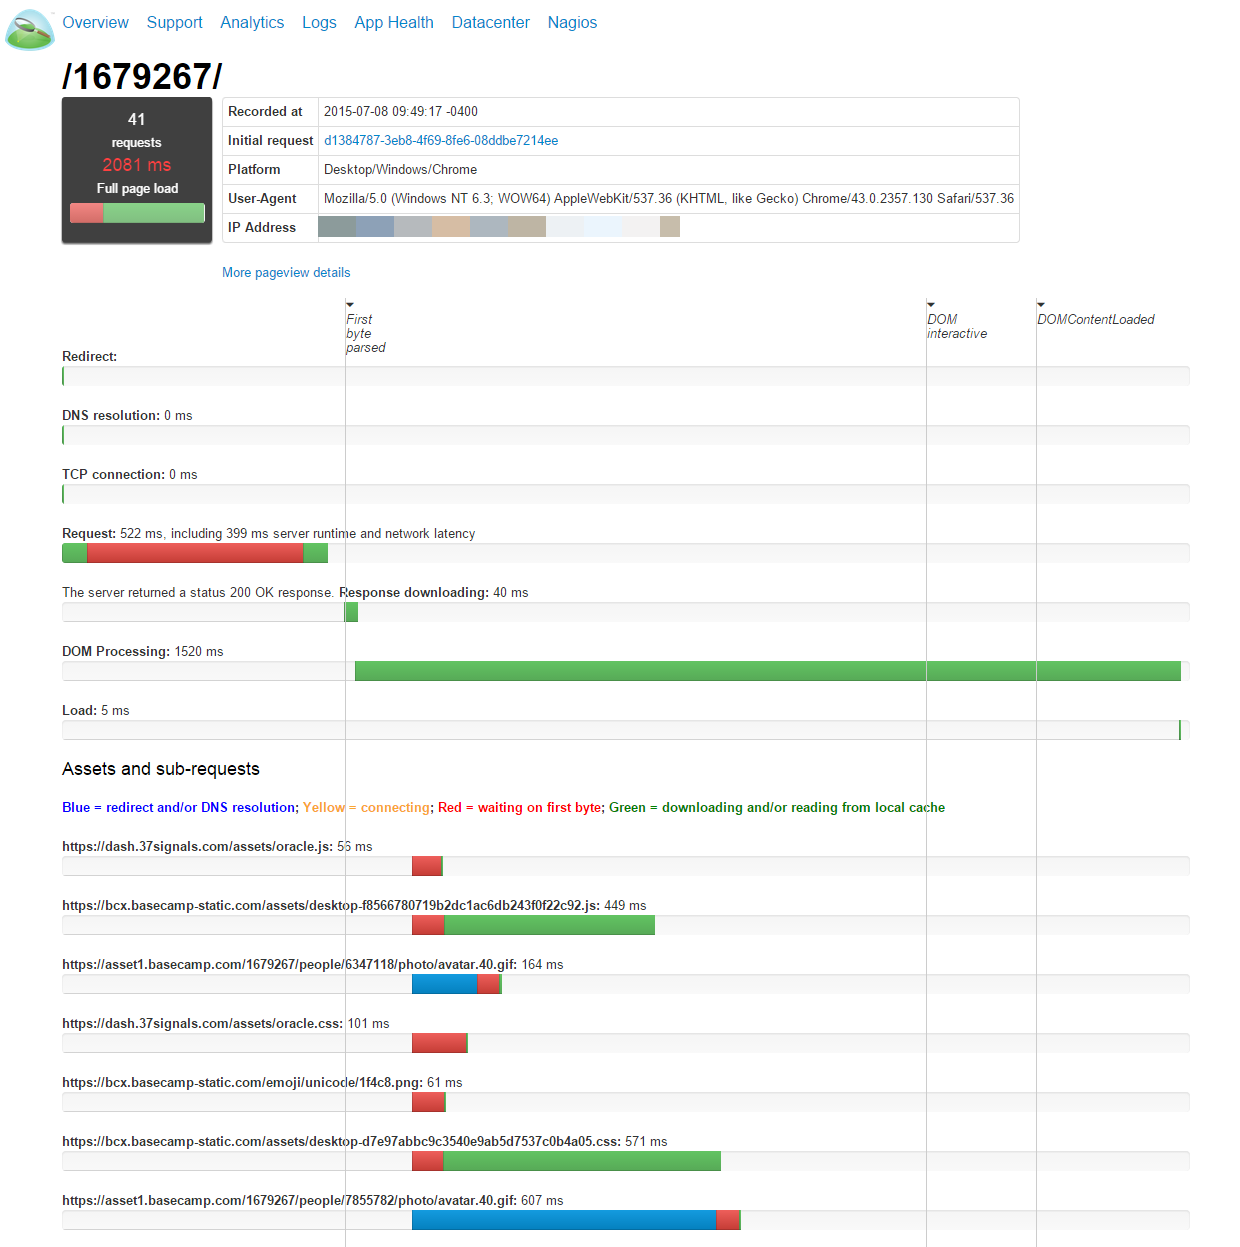
This page shows the full request/response waterfall, including DNS resolution, TCP connection, SSL negotiation, request and server runtime, downloading, and DOM processing. It also shows timing for the additional assets or ancillary requests that were loaded.
One of the most useful features of Oracle is having instant access to all of the logs for a request. Clicking on the request ID under “Initial request” will load the Rails, load balancer, and any other logs for the first request of the page load.
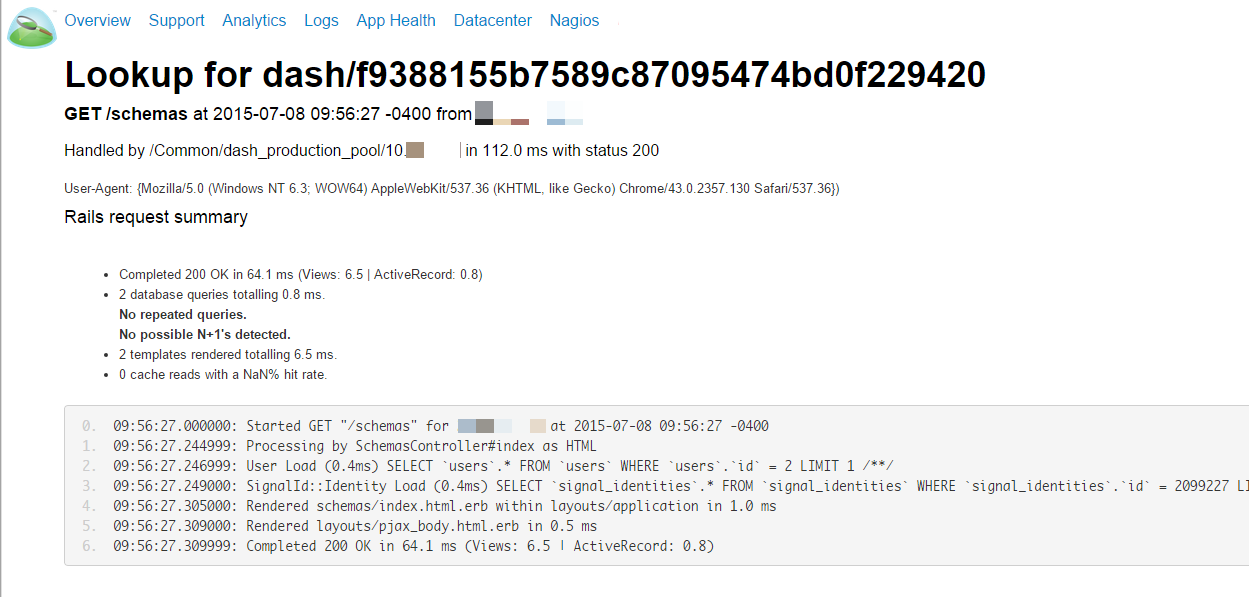
In addition to presenting the raw Rails logs for the request, we also try to do a little bit of helpful work for you—we identify duplicated queries, possible N+1 queries, cache hit rates, etc. In most cases, timing details and logs are available in the dashboard within two seconds of the page load completing.
Oracle is just one of the tools we put to work to try to make Basecamp fast for all users. Read more about other things we do to keep Basecamp fast and available for you.
Jure
on 08 Jul 15Awesome stuff! Are you guys planning on releasing the Oracle to the public in some form?
NL
on 08 Jul 15@Jure – I’d love to say yes, but realistically it’s unlikely to happen. This is one of those things where the real value comes from the whole ecosystem - it’s not just the widget, it’s also the dashboard and the data pipeline that gets the data from Oracle into HBase and back out. It’s hard to cleanly separate out individual components from everything else that’s built around it - Oracle released by itself wouldn’t really be of much use.
Jakob
on 08 Jul 15@Basecamp
I wish this post would have been about how you used Oracle to find and diagnosis a specific performance bottleneck and talk about the before and after improvement.
Maybe next time.
Just my 2 cents.
Jakob
on 08 Jul 15Something more like this old article
/posts/3137-using-event-capturing-to-improve-basecamp-page-load-times
GregT
on 08 Jul 15I swear I have heard that some other company has a product named ‘Oracle’. Maybe even the company itself? Probably way less cool than you guys.
Nate Berkopec
on 10 Jul 15For people looking for an Oracle-like tool for use on their own projects, I’d suggest rack-mini-profiler in combination with Chrome Timeline. rack-mini-profiler is a great ruby gem that does a lot of the things mentioned here, and Chrome Timeline will give you a lot of the frontend timing that Oracle seems to provide.
This discussion is closed.