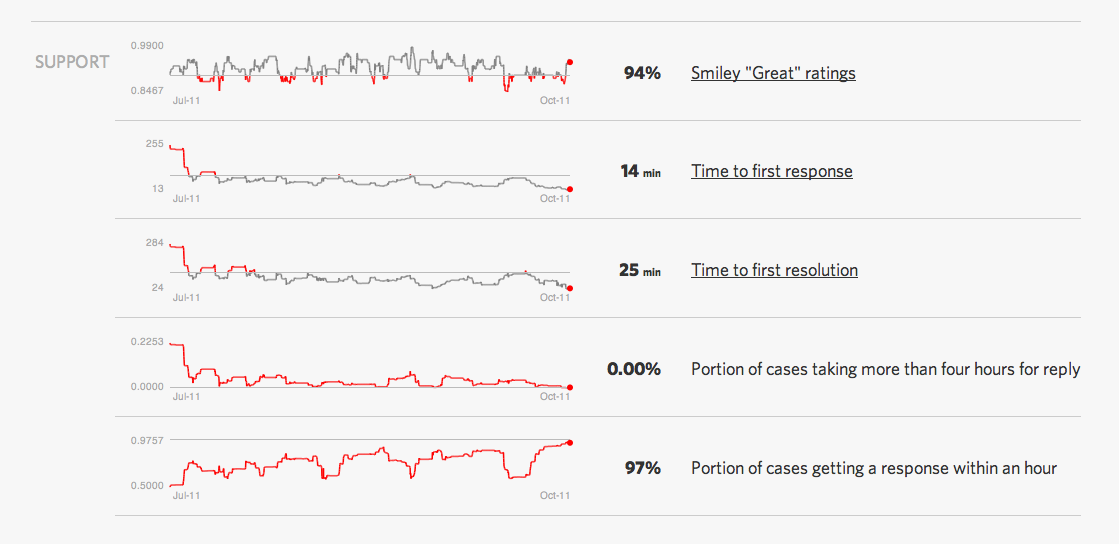
Our support team works hard every day to make our customers happy, and we’re always proud to show how great a job they do.
In addition to making customers happy, our fantastic team also answers questions fast. Across the last 500 new cases we’ve received during our normal hours, we’ve responded to 97% in less than hour, with the average case answered in 14 minutes and solved in 25 minutes.
Our team has been steadily improving at this too. Over the last few months, we’ve steadily cut down response times, all while maintaining or improving customer happiness.
Congratulations to Michael, Ann, Kristin, Merissa, Joan, and Chase!


Chris Oliver
on 13 Oct 11What do you guys use to graph this?
Joris Witteman
on 13 Oct 11Am I to understand that you guys put the bar at 90% “Smiley Great” reviews? That rocks.
Kevin
on 13 Oct 11Nice job on the feedback!
Ditto on the graph question. It looks really good.
Natalie Keshlear
on 13 Oct 11Wow! Great job – that is really incredible! This is something to look up to.
Cheers, Natalie – SoundCloud Community Team
NL
on 13 Oct 11@Chris and @Kevin – we have an internal dashboard that provides us with these. The graphs themselves are generated using protovis.
Rishi
on 13 Oct 11That is awesome!
Potential Future Blog Post Idea: What have you guys have done to reduce customer support response time.
Thanks.
Stephane Guerin
on 13 Oct 11Nice! I was just looking for ideas of tech support KPIs!
Awesome job by the way :)
Kyle West
on 13 Oct 11Still using Assistly?
MB
on 13 Oct 11@Kyle – yup, still using Assistly.
James Mitchell
on 13 Oct 11For anything complicated, telephone support is vastly superior to email or Web-based support. One of the many reasons I would never use 37 Signals’ products in a million years is their lack of telephone support.
Joe Hallissey
on 13 Oct 11@James I’ve used 37 Signals products for years and haven’t had an issue that couldn’t be resolved over email. Probably creating a well-made product from the start helps cut down on the complicated issues.
Besides from no telephone support, why not give them a shot?
Taylor Brooks
on 13 Oct 11Those graphs look awesome. Are the graphs for user sign-ups, attrition rate, upgrades, etc, similar?
I’d be curious to see what the interface looks like.
Guy
on 14 Oct 11Really interesting that for the first half of the timeline the smiley rate is approximately inverse to the time to first response/resolution rates. After that it seems to break down and I wonder what changed.
My hypothesis is certainly not that response time is the top factor is smileyness but that there is a 3rd correlation with ‘new case rate’ which in turn crushes the individual attention on the active case. Would be great to see a new case rate curve (even without numbers) just to see if that is an effect.
Congratulations on getting where you have already. I wish I needed your products!
Alexander
on 14 Oct 11THANK YOU!!! I so appreciate this site.This is news I need to know.
Hamid
on 14 Oct 11That’s awesome. Great job.
Richardprichard
on 14 Oct 11These graphs need some horizontal detail.
There is periodicity to the results, and you can’t tell why. Is it a weekend thing ? A public holiday thing ?
I’d start by putting 7-day ticks in and seeing if that told me anything.
But, anyway, nice.
Ryan
on 14 Oct 11This is a shitty way to measure customer support. The emphasis on time to first reply just encourages ill conceived crappy first responses, like the one we got where we were told not to worry about the phantom user lurking in our chat room. Turned out to be a hacker. Whoops.
How many other disasters are in the six percent non smileys?
Ryan
on 14 Oct 11PS we may have given you a smiley too, because based on your bad support we thought you had done a good job. Customer service is not about stats. What are you Microsoft? Sales force? Awesome tps report.
DHH
on 15 Oct 11Ryan, sorry you had a bad experience. Feel free to ping me at david at 37signals.com with more details. I’d be happy to follow up.
But arguing that statistics are not useful for tracking customer service flies in the face of everything we’ve seen so far. When you have a large team and hundreds of daily interactions, the only way you can have a sense of improvement or regression is through data gathering.
It’s been incredibly beneficial for us to identify areas that cause customers to be unhappy with our support and correct those issues.
Peaches
on 17 Oct 11Ping you? Is this the new hipster ‘lingo’?
Tyler
on 17 Oct 11Have you ever overlaid graphs of new customer sign ups or marked on the c-sat graphs when certain marketing pushes took place? It might be interesting to see if there is a correlation between decreasing customer satisfaction and overall business activity.
This discussion is closed.