The home button on the iPhone 4 stopped working properly for both Jason and I recently. Requiring hard presses or multiple tries to work. It appears that lots of people have this problem. Has it happened to you yet? Let’s track this.
Steve Jobs changed
He changed computers.
He changed software.
He changed design.
He changed publishing.
He changed film.
He changed music.
He changed advertising.
He changed retail.
He changed business.
He changed beige.
He changed expectations.
He changed our minds.
He changed them.
He changed us.
He changed you.
“Don’t be sad because it’s over. Smile because it happened.” – Dr. Seuss
Now what are you going to change?
37colors

This weekend during the Ravenswood Art Walk, I visited Lorna’s Laces. They hand-dye yarns in some really beautiful color combinations. I took some photos to share, because sometimes it’s nice to look at pretty things!
Designers, how do you put colors together? Where do you find inspiration?

The rhythms of 37signals

I was thinking this morning about what I perceived to be my normal working pattern—lots in the morning, then tapering out from mid-day on with an occasional bump in the evenings. I wanted to see if this was quantifiable through git logs, and I decided to look across a wide range of our repositories.
The chart below shows the portion of each person’s commits that occur within a given hour of the day in their local time.
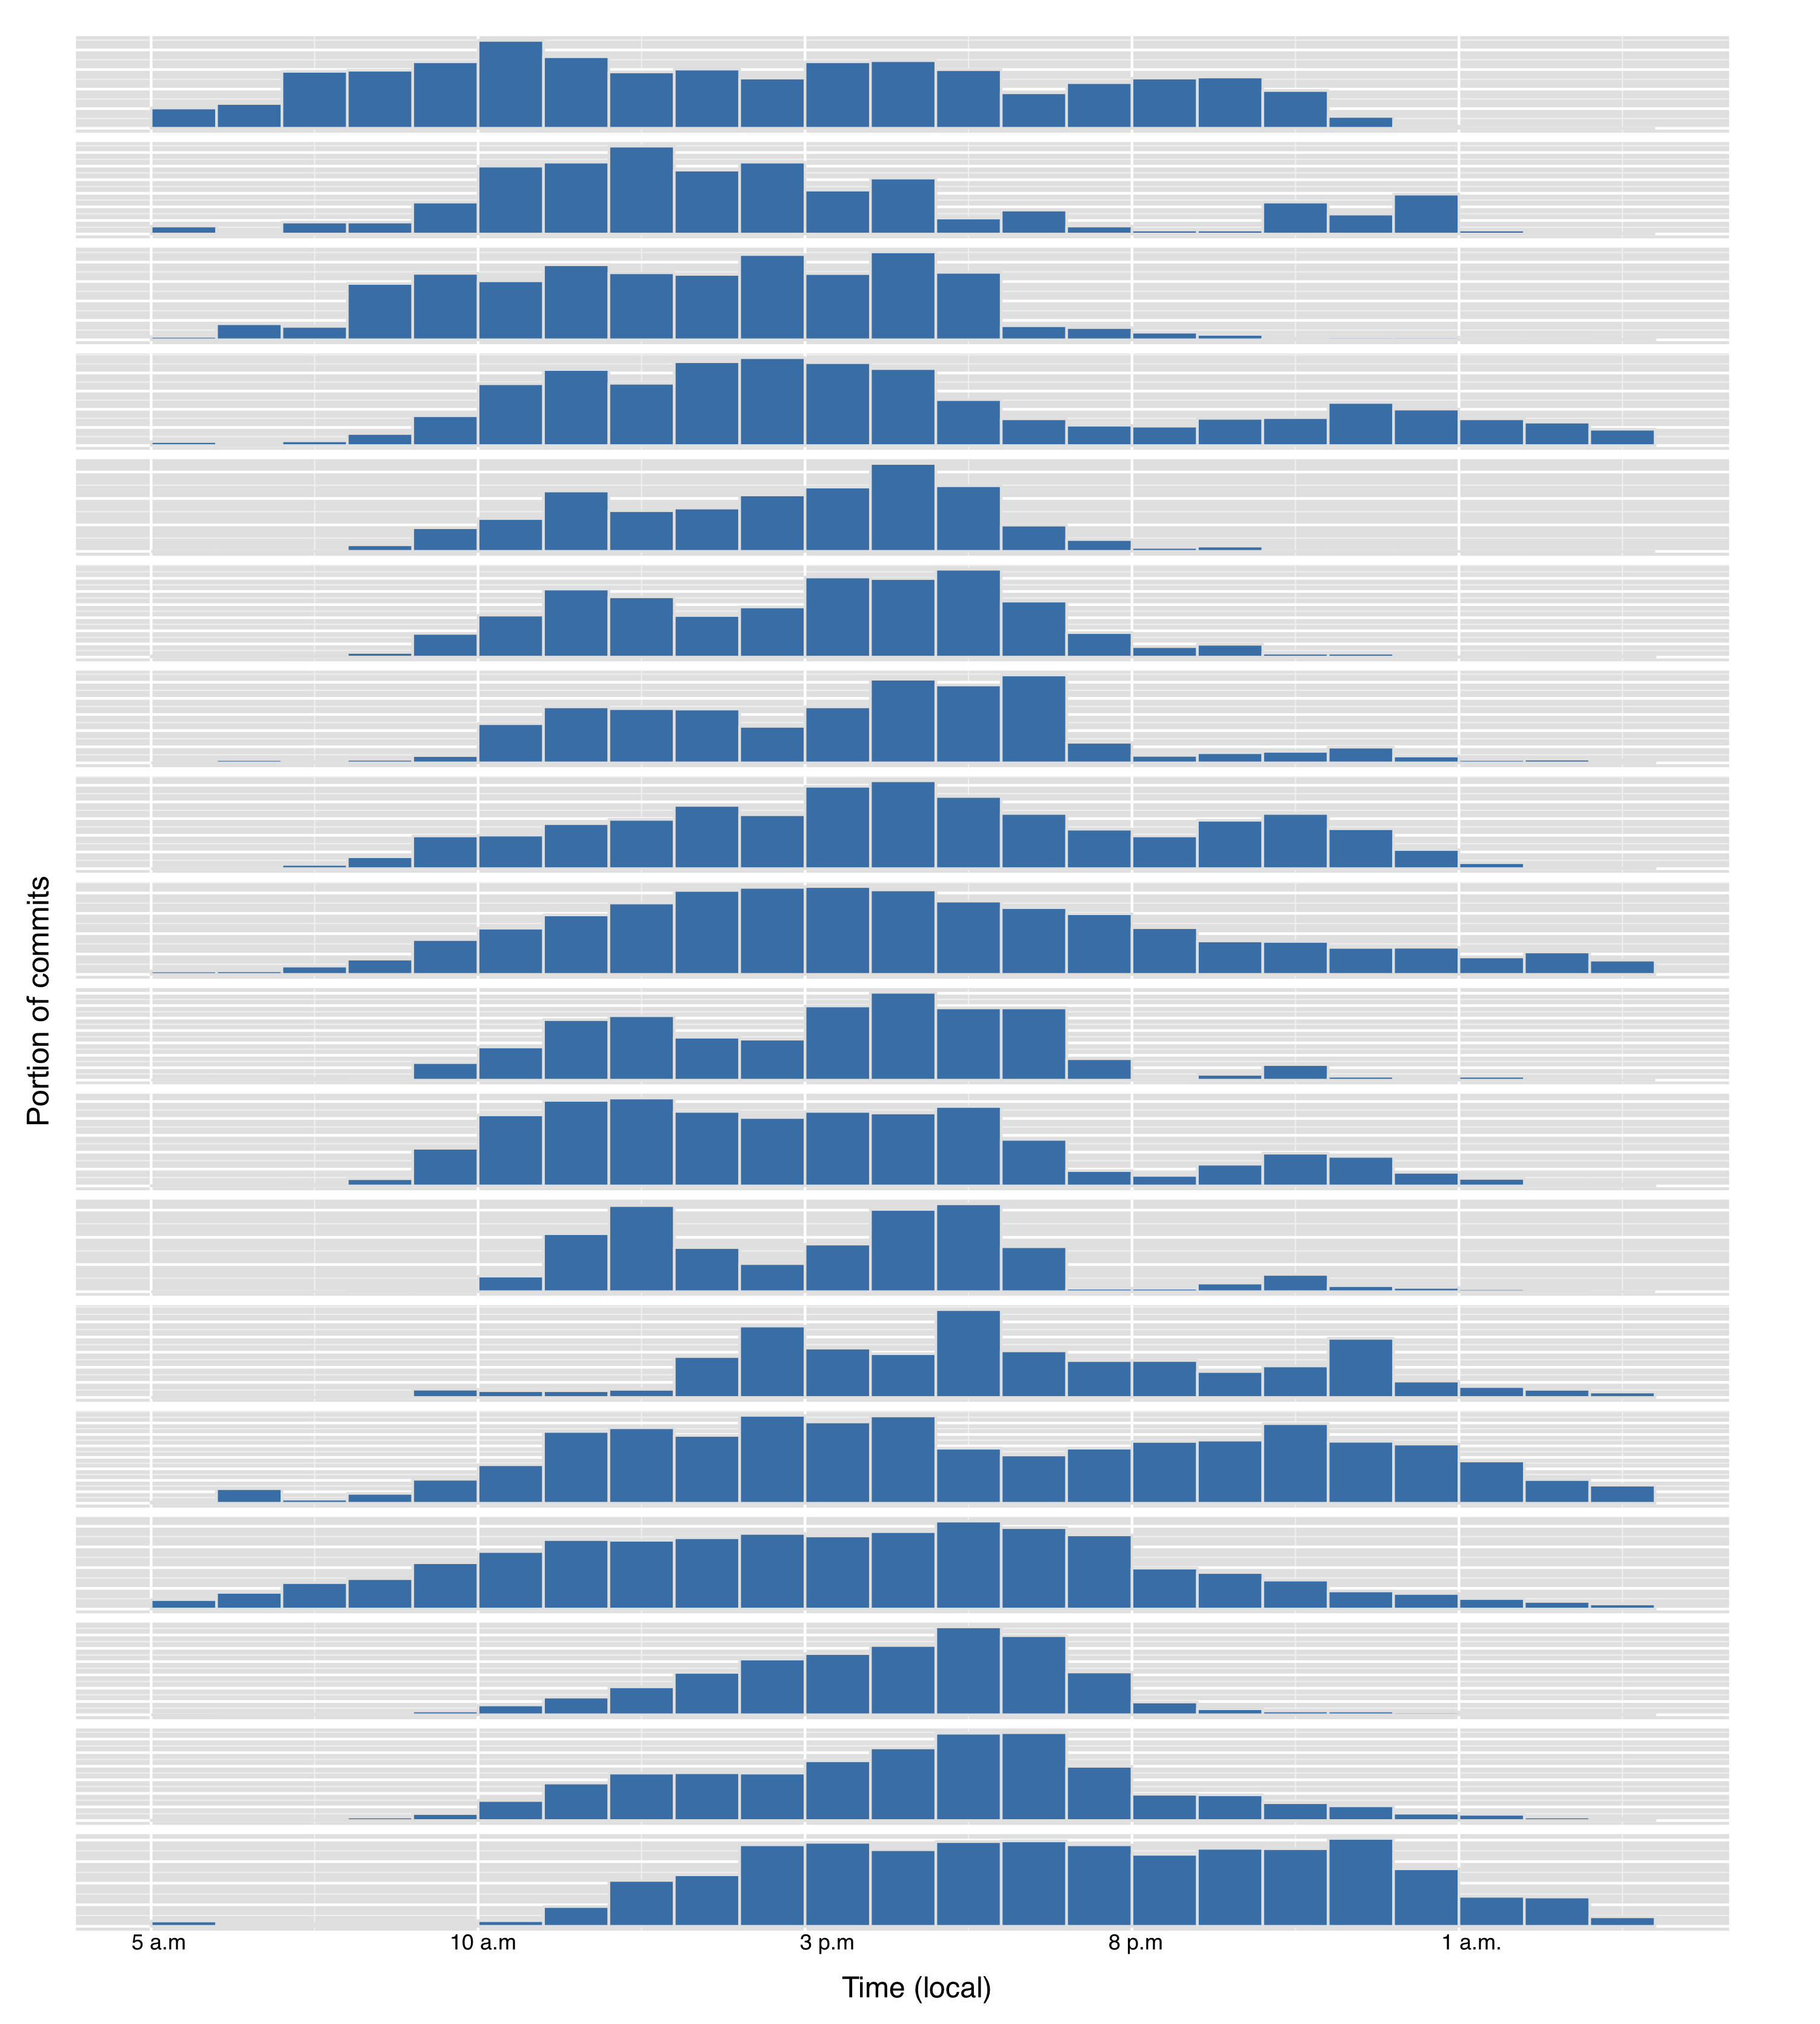
As you can see, there’s a wide range in preferred working hours – one of the great advantages of working in slow time is that this is absolutely fine. There’s enough overlap in hours for people to be able to work together, but enough flexibility to work when you want to.
API design for humans
One of the things about working with data at 37signals is that I end up interacting with a lot of different APIs—I’ve used at least ten third-party APIs in the last few months, as well as all of our public APIs and a variety of internal interfaces. I’ve used wrappers in a couple different languages, and written a few of my own. It’s fair to say I’ve developed some strong opinions about API design and documentation from a data consumer’s perspective.
From my experience, there are a few things that really end up mattering from an API usability perspective (I’ll leave arguments about what is truly REST, or whether XML or JSON is actually better technically to someone else).
Tell me more: documentation is king
I have some preferences for actual API design (see below), but I will completely trade them for clear documentation. Clear documentation includes:
- Examples that show the full request. This can be a full example using
curllike we provide in our API documentation, or just a clear statement of the request like Campaign Monitor does for each of their methods.
- Examples that show what the expected response is. One of the most frustrating things when reading API documentation is not knowing what I’m going to get back when I utilize the API—showing mock data goes along way towards this. Really good API documentation like this would let you write an entire wrapper without ever making a single request to the API. Campaign Monitor and MailChimp both have good, but very different takes on this.
- A listing of error codes, what they mean, and what the most common cause of receiving them is. I’m generally not the biggest fan of the Adwords API in many ways, but they are a great example of exhaustively documenting every single response code they return.
- A searchable HTML interface. Whether it’s visually appealing doesn’t really matter much, and Google indexing it is plenty of search. What doesn’t work for me is when the API documentation is in PDF, or I have to authenticate to get access to it.
- Communication of versioning and deprecation schedules. There’s some debate about whether versioning is better than gradual evolution, but regardless, anytime you’re changing something in a way that might break someone’s existing code, fair warning is required, and it should be on your documentation site. Sometimes you have to make a change for security reasons that don’t allow much advance notice, but wherever possible, providing a couple of weeks notice goes a long way. The Github API clearly shows what will be removed when and shows the differences between versions clearly.
Basecamp eliminates time zone math
Question: If your company is boarding a train at 1pm in Boston, but you’re living in Denver, and you have a client living in London, what time does the train reach Philadelphia?
Answer: You don’t have time to figure this out. You have work to do.
Basecamp can now eliminate the time zone confusion!
Continued…Behind the Scenes: Internet Connectivity

Last year, we suffered a number of service outages due to network problems upstream. In the past 9 months we have diligently worked to install service from additional providers and expand both our redundancy and capacity. This week we turned up our third Internet provider, accomplishing our goals of circuit diversity, latency reduction and increased network capacity.
We now have service from Server Central / Nlayer Networks, Internap and Level 3 Communications. Our total network capacity is in excess of 1.5 gigabits per second, while our mean customer facing bandwidth utilization is between 500 megabits and 1 gigabit. In addition, we’ve deployed two Cisco ASR 1001 routers which aggregate our circuits and allow us to announce our /24 netblock (our own IP address space) via each provider.
Keeping Basecamp, Highrise, Backpack, and Campfire available to you at all times is our top priority, and we’re always looking for ways to increase redundancy and service performance. This setup has prevented at least 4 significant upstream network issues from becoming customer impacting… which we can all agree is great!
A/B Testing Tech Note: determining sample size
In discussions on our posts about A/B testing the Highrise home page, a number of people asked about sample size and how long to run a test for. It’s a good question, and one that’s important to understand. Running an A/B test without thinking about statistical confidence is worse than not running a test at all—it gives you false confidence that you know what works for your site, when the truth is that you don’t know any better than if you hadn’t run the test.
There’s no simple answer or generic “rule of thumb” that you can use, but you can very easily determine the right sample size to use for your test.
What drives our needed sample size?
There are a few concerns that drive the sample size required for a meaningful A/B test:
1) We want to be reasonably sure that we don’t have a false positive—that there is no real difference, but we detect one anyway. Statisticians call this Type I error.
2) We want to be reasonably sure that we don’t miss a positive outcome (or get a false negative). This is called Type II error.
3) We want to know whether a variation is better, worse or the same as the original. Why do we want to know the difference between worse vs same? I probably won’t switch from the original if the variation performs worse, but I might still switch even if it’s the same—for a design or aesthetic preference, for example.
What not to do
There are a few “gotchas” that are worth watching out for when you start thinking about the statistical significance of A/B tests:
1) Don’t look at your A/B testing tool’s generic advice that “about 100 conversions are usually required for significance”. Your conversion rate and desired sensitivity will determine this, and A/B testing tools are always biased to want you to think you have significant results as quickly as possible.
2) Don’t continuously test for significance as your sample grows, or blindly keep the test running until you reach statistical significance. Evan Miller wrote a great explanation of why you shouldn’t do this, but briefly:
- If you stop your test as soon as you see “significant” differences, you might not have actually achieved the outcome you think you have. As a simple example of this, imagine you have two coins, and you think they might be weighted. If you flip each coin 10 times, you might get heads on one all of the time, and tails on the other all of the time. If you run a statistical test comparing the portion of flips that got you heads between the two coins after these 10 flips, you’ll get what looks like a statistically significant result—if you stop now, you’ll think they’re weighted heavily in different directions. If you keep going and flip each coin another 100 times, you might now see that they are in fact balanced coins and there is no statistically significant difference in the number of heads or tails.
- If you keep running your test forever, you’ll eventually reach a large enough sample size that a 0.00001% difference tests as significant. This isn’t particularly meaningful, however.
3) Don’t rely on a rule of thumb like “16 times your standard deviation squared divided by your sensitivity squared”. Same thing with the charts you see on some websites that don’t make their assumptions clear. It’s better than a rule of thumb like “100 conversions”, but the math isn’t so hard it’s worth skipping over, and you’ll gain an understanding of what’s driving required sample size in the process.
How to calculate your needed sample size
Instead of continuously testing or relying on generic rules of thumb, you can calculate the needed sample size and statistical significance very easily. For simplicity, I’ve assumed you’re doing an A vs B test (two variations), but this same approach can be scaled for other things.
Continued…Four tips for learning how to program
I recently received an email from someone who was getting into programming, and was asking for advice on how to proceed. He had a project in mind, and had started on it, but had run into areas where his current knowledge was insufficient to puzzle out the solution.
First of all, I was very impressed that he had actually started work. Ideas are a dime-a-dozen, and one of my least favorite things are “idea people” who feel like their work is done when they come up with an idea, and all that’s left is to find a programmer who is willing to fill in the blanks. That this person came to me after first trying to solve it himself was a huge mark in his favor.
Sadly, I wasn’t able to help him take his project further, but it gave me a chance to think back on the times that I’ve been a beginner (whether it was web programming, or iOS programming, or even something unrelated to software entirely), and to contemplate how I approached those beginnings.
I identified four things that I’ve found were fundamental to my particular learning style. Obviously, there are as many learning styles as their are learners, but these are what work for me.
Continued…Tell friends about Basecamp. Save them $10, you might win great prizes.

Basecamp became the world’s most popular web-based project management app because happy customers have recommended it to their friends and colleagues. It’s been amazing to see how Basecamp’s popularity has risen primarily through word-of-mouth.

Basecamp Tell a Friend Contest
We want to help you spread the word to your friends, so we made the Basecamp Tell a Friend Contest. Here’s how it works:
- Sign up with your Basecamp account at https://tellafriend.37signals.com.
- We’ll give you a special link that you can tweet, share on Facebook, or email to your friends.
- Every person that signs up from your link for a paid Basecamp plan will get $10 off their first month.
- Every person you sign up counts as a chance to win one of our prizes.
This contest ends on January 2, 2012. Sign up today and start saving your friends $10 off their first month.